Here's a look at everything you'll see during a workout.
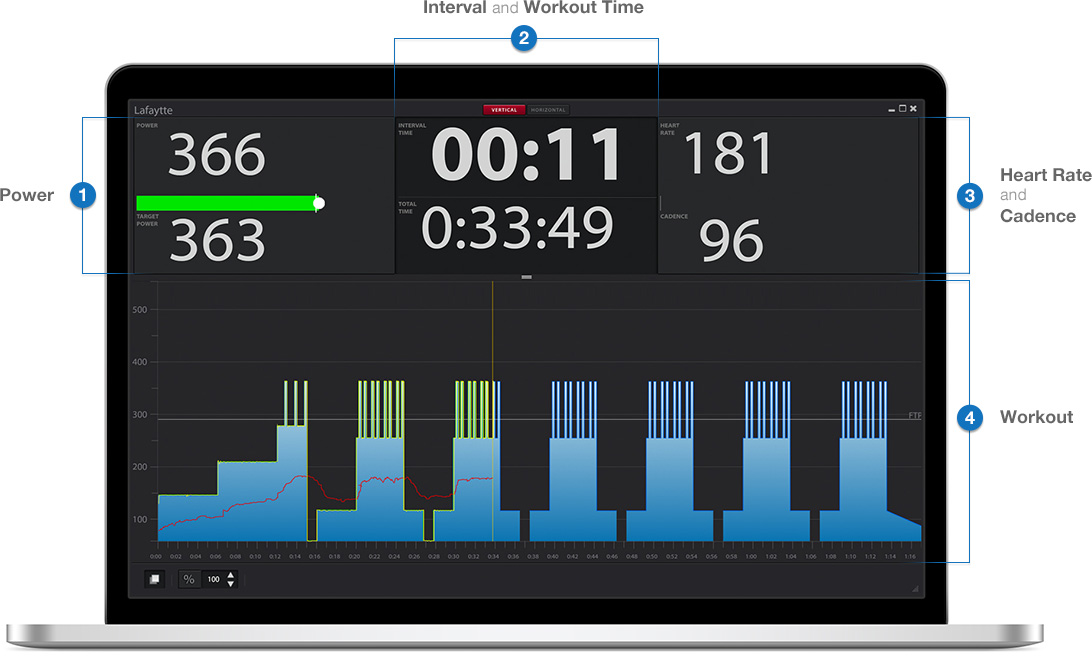
Power
1. Power
Power displays your current power output.
2. Target Power
Target Power is the prescribed power output you should be striving to achieve.
3. Target Power Bar
The Target Power Bar represents how close you are to your target power. The bar will stay green as long as you are close to your target power.
4. Average Power Dot
The white dot represents your average power for the interval. If the prescribed interval keeps you at a steady power level, you'll want to try and align the white dot with the vertical white line.
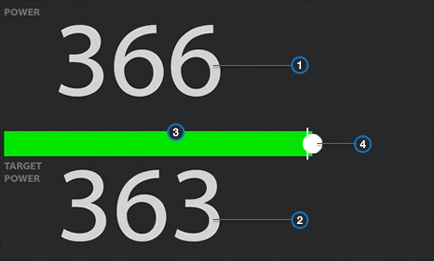
Interval and Workout Time
1. Interval Time
Interval Time indicates the amount of time remaining in the current interval.
2. Total Time
Total Time indicates the amount of time elapsed in the workout.
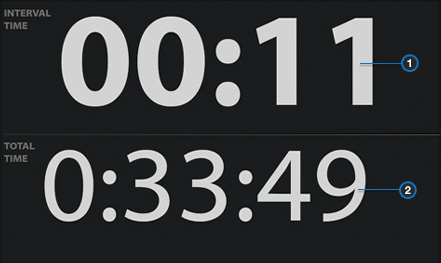
Heart Rate and Cadence
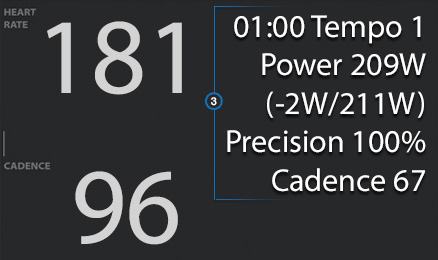
1. Heart Rate
Heart Rate displays your current HR reading.
2. Cadence
As long as you have a cadence sensor connected to TrainerRoad, your cadence will display in revolutions per minute (RPM).
3. Interval Summary
TrainerRoad displays a prompt that appears in the upper right-hand corner of the workout screen that gives you information about the interval you just completed. If you have a heart rate monitor paired, this will also be displayed in the summary.
- Interval Time/Zone: The top line indicates how long the interval you just finished was. The Zone in which the interval was performed is also noted here.
- Average Power: The second line displays your average power for the interval.
- Distance from Target Power: The third line indicates how close you came to your target power. So, the screenshot above indicates that the rider was two watts below their target power of 211 watts.
- Precision: The fourth indicates how close you came to your target power during the interval.
- Cadence: The fifth line will display your average cadence for the interval.
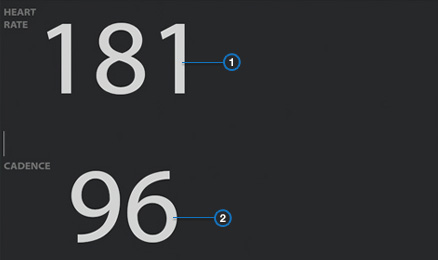
Workout
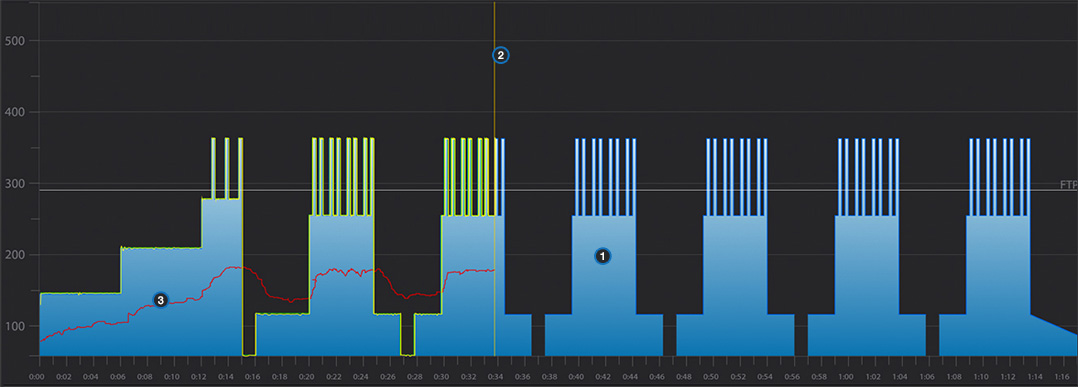
1. Workout Profile
Represented in blue, the workout's profile displays the format of the workout, including intervals and rest. The x-axis represents time, and the y-axis represents watts.
2. Vertical Yellow Line
The vertical, yellow line represents the rider's current position within the workout.
3. Horizontal Colored Lines
- Green: The green line represents where your power should be based on the intensity you have the workout set to. If your workout intensity is set to 100%, the green line will fall directly atop the blue workout profile.
- Red: The red line represents your heart rate.
- White: The white line represents your cadence readings for the ride. (Note: The white cadence line is only displayed on the post-workout graph.)
- Yellow: The horizontal yellow line represents your power (or VirtualPower).