Dig into the details of your indoor ride, including power, heart rate, cadence, TSS, Intensity Factor, and more in the workouts ride analysis page. You will see a ride analysis page for both indoor and outdoor cycling workouts with full breakdown of the workout and the data from that workout.
How to Find a Workouts Ride Analysis Page
Step One: Log in to your account on the TrainerRoad website.
Step Two: In the left sidebar, select Career and click Activity List. You can filter by activity type, filter by zone, or search for a ride by name.
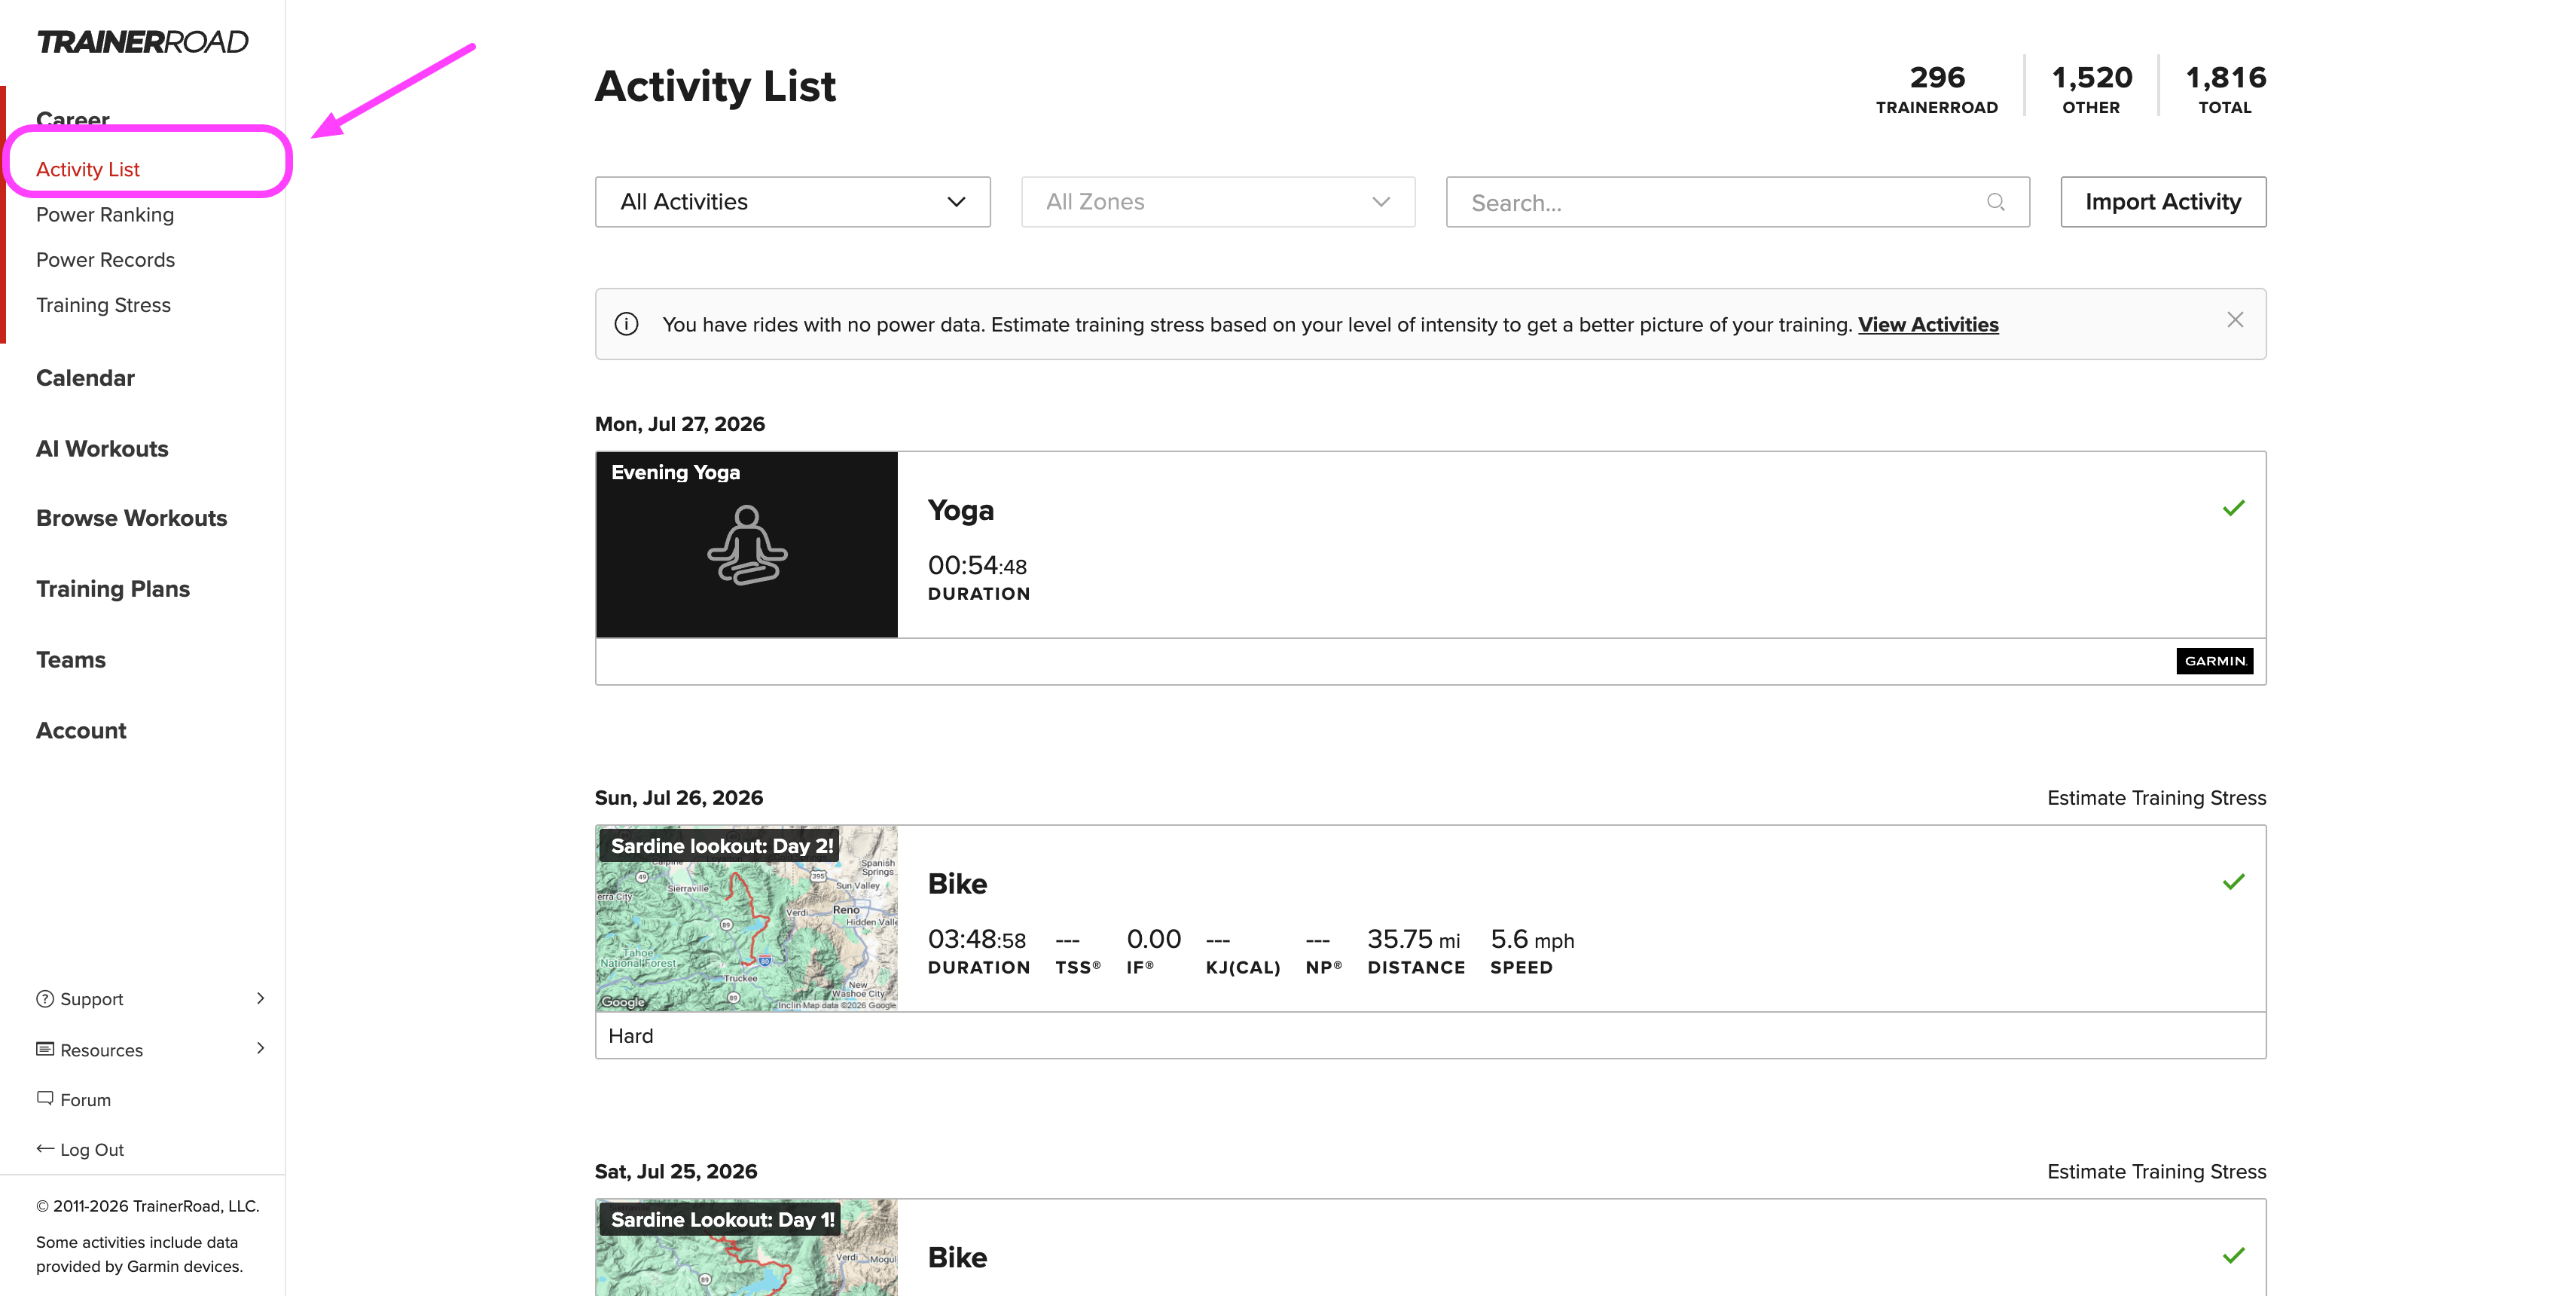
Step Three: Click any ride from this list to open its Ride Analysis page.
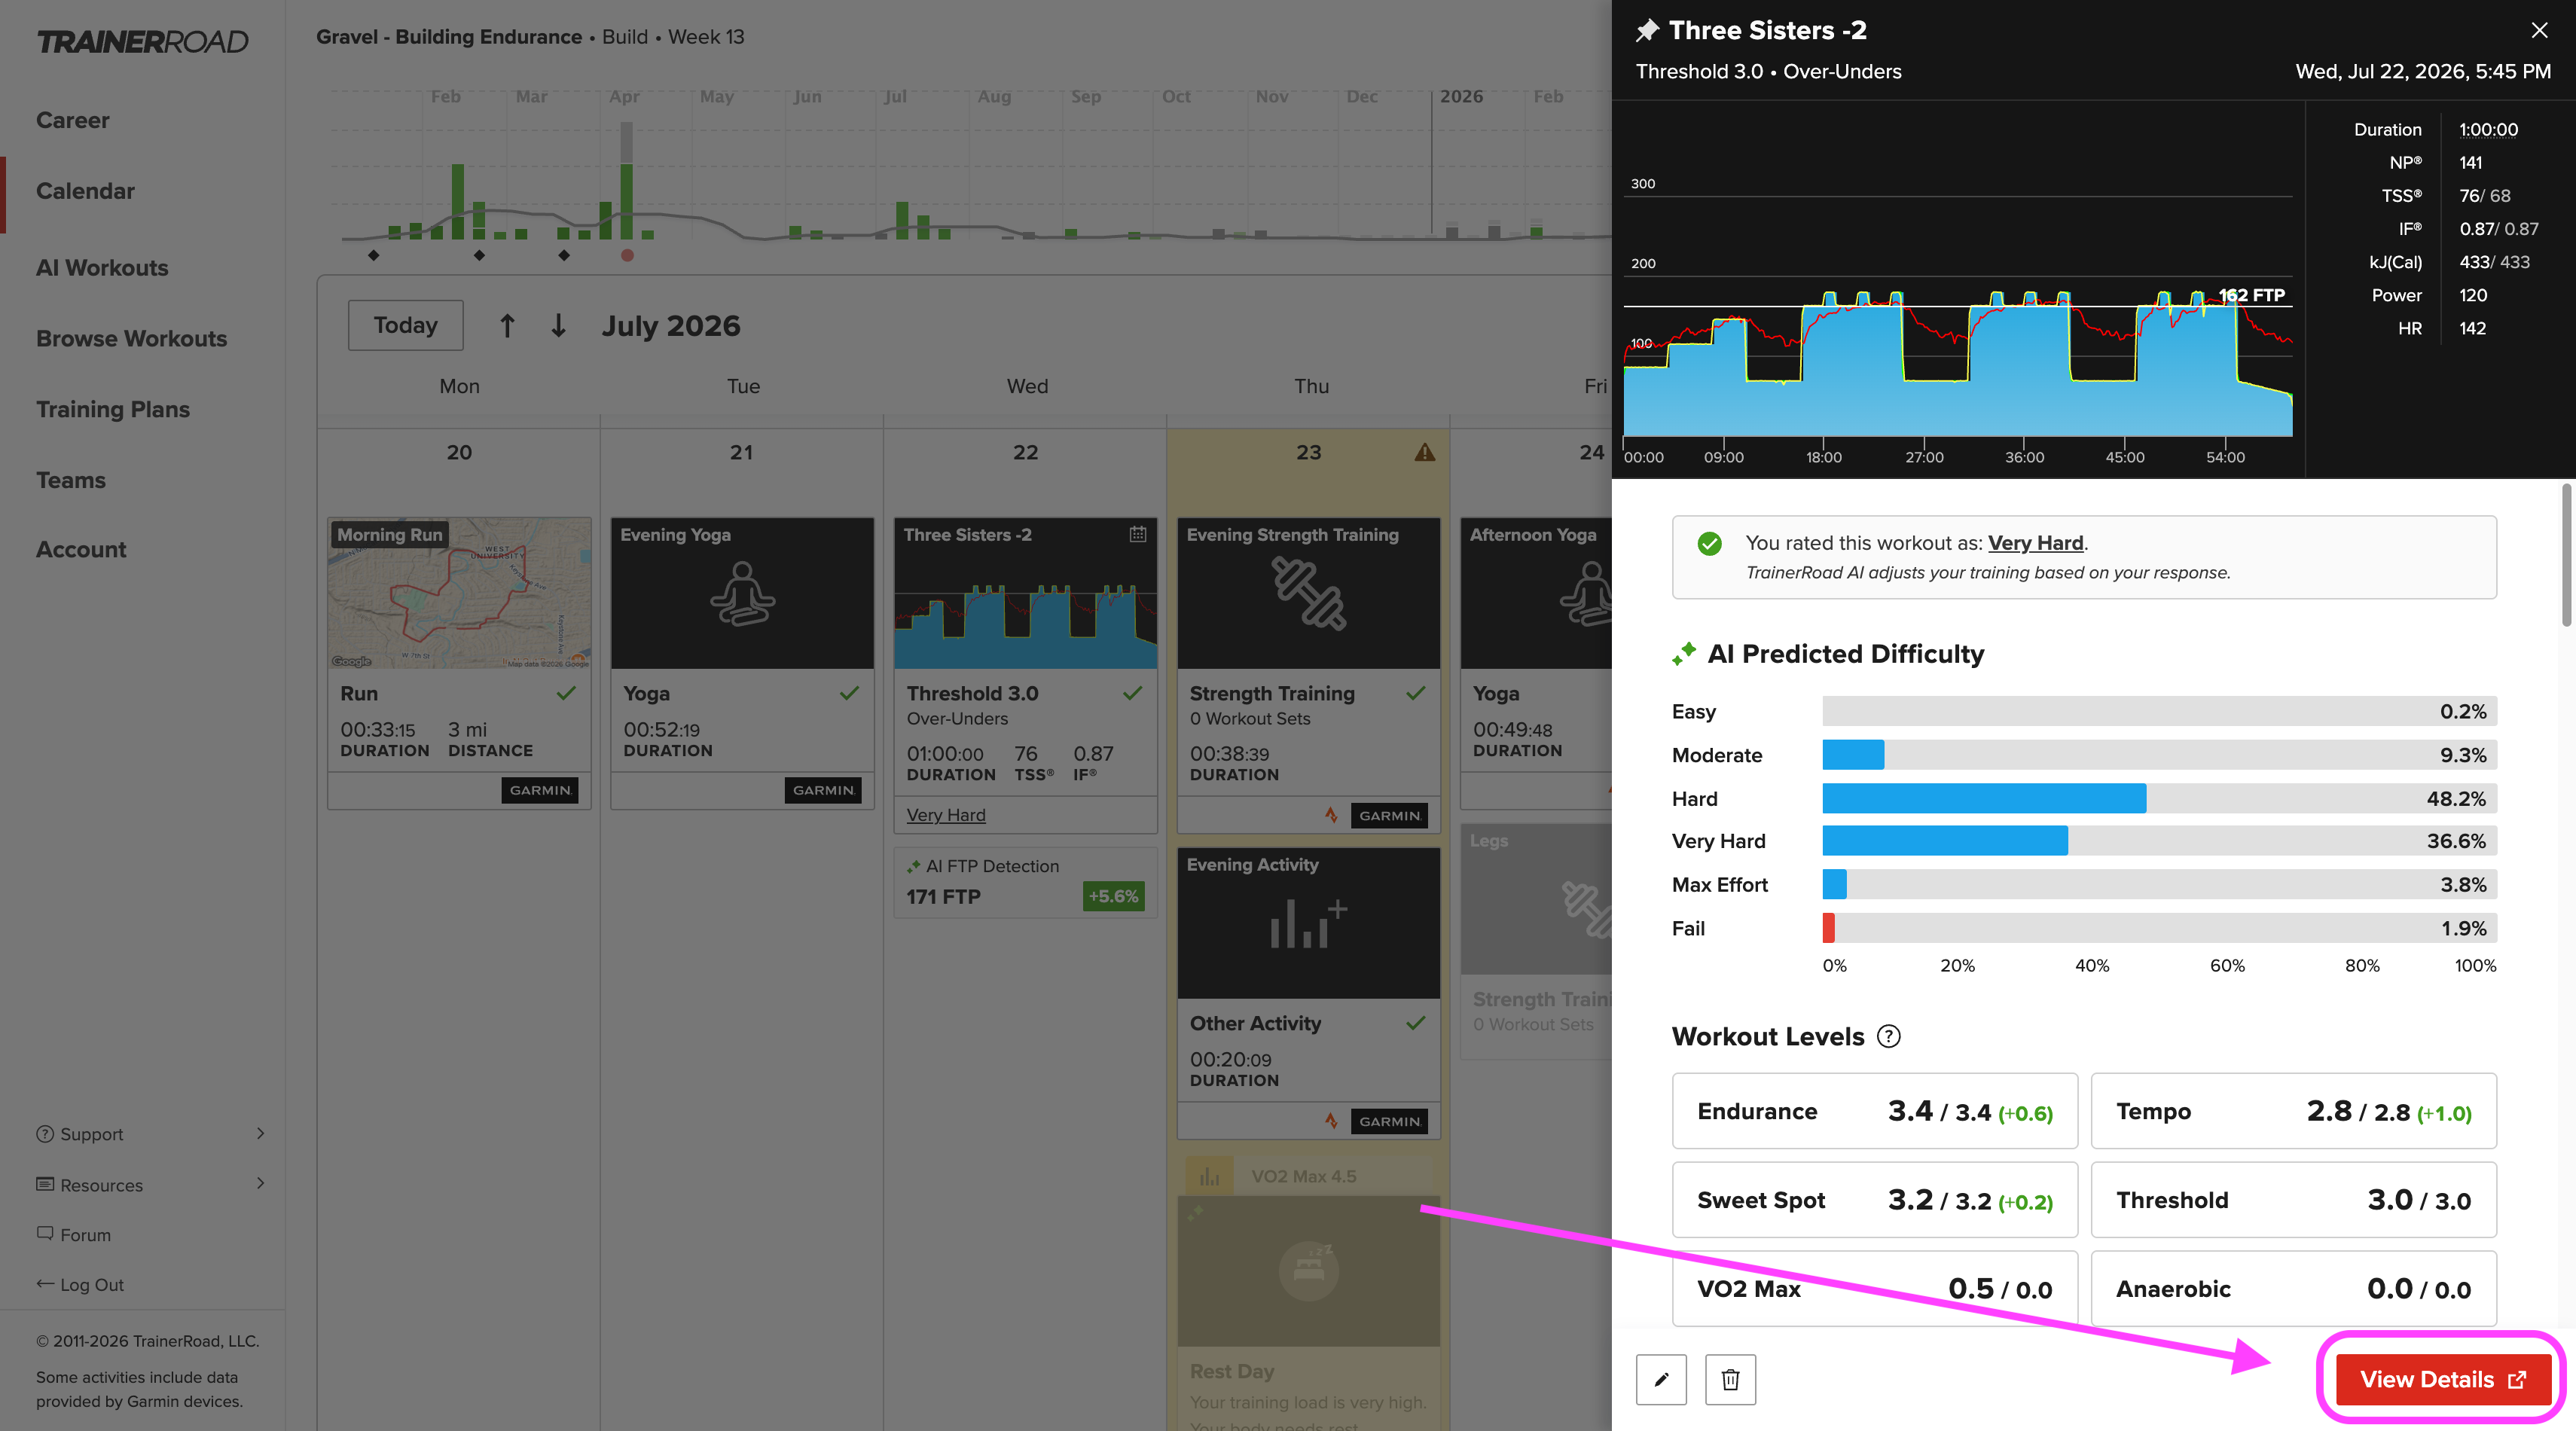
You can also open a completed ride directly from your Calendar by selecting the ride on the Calendar and then selecting View Details:
Everything Included in the Workout Analysis Page
The workout analysis page includes a few different sections. Here's what each section includes and how to drill into them:
The Workout Graph
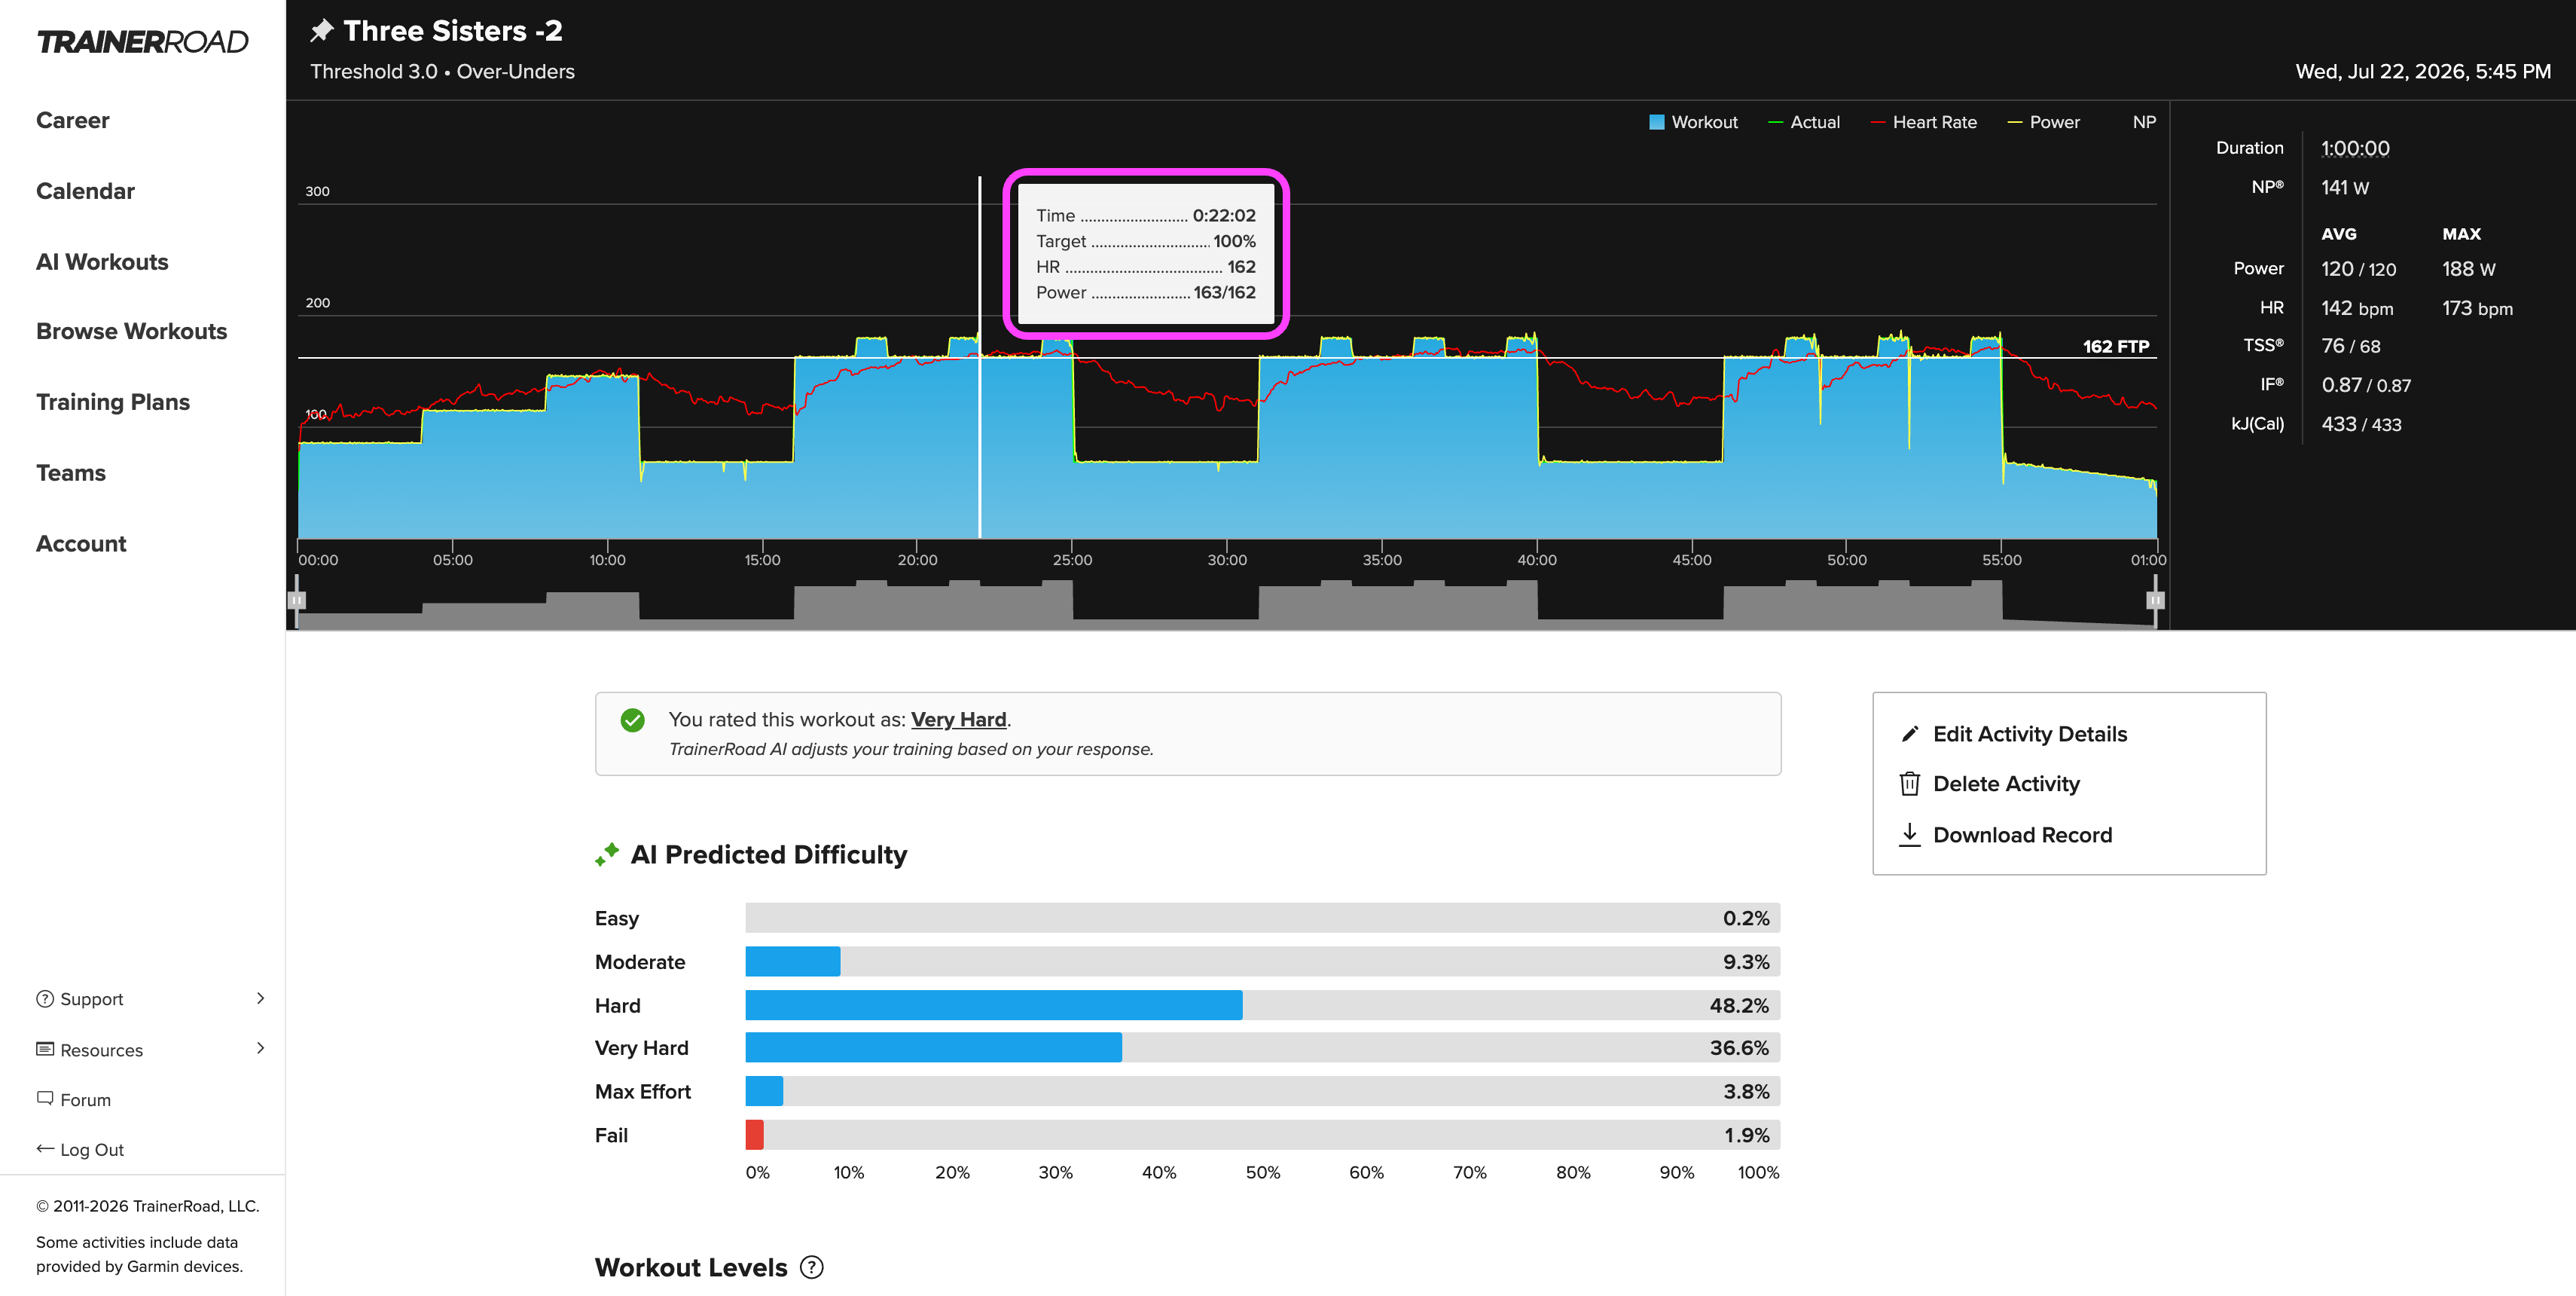
The graph at the top of the page shows your ride from start to finish. Move your cursor along the graph to see target power, heart rate, and power for any moment in the ride.
Within the workout graph you can click and drag across the graph to select a section of your ride. The metrics panel updates to show stats for just that selection, so you can check the numbers on a single climb, interval, or surge.
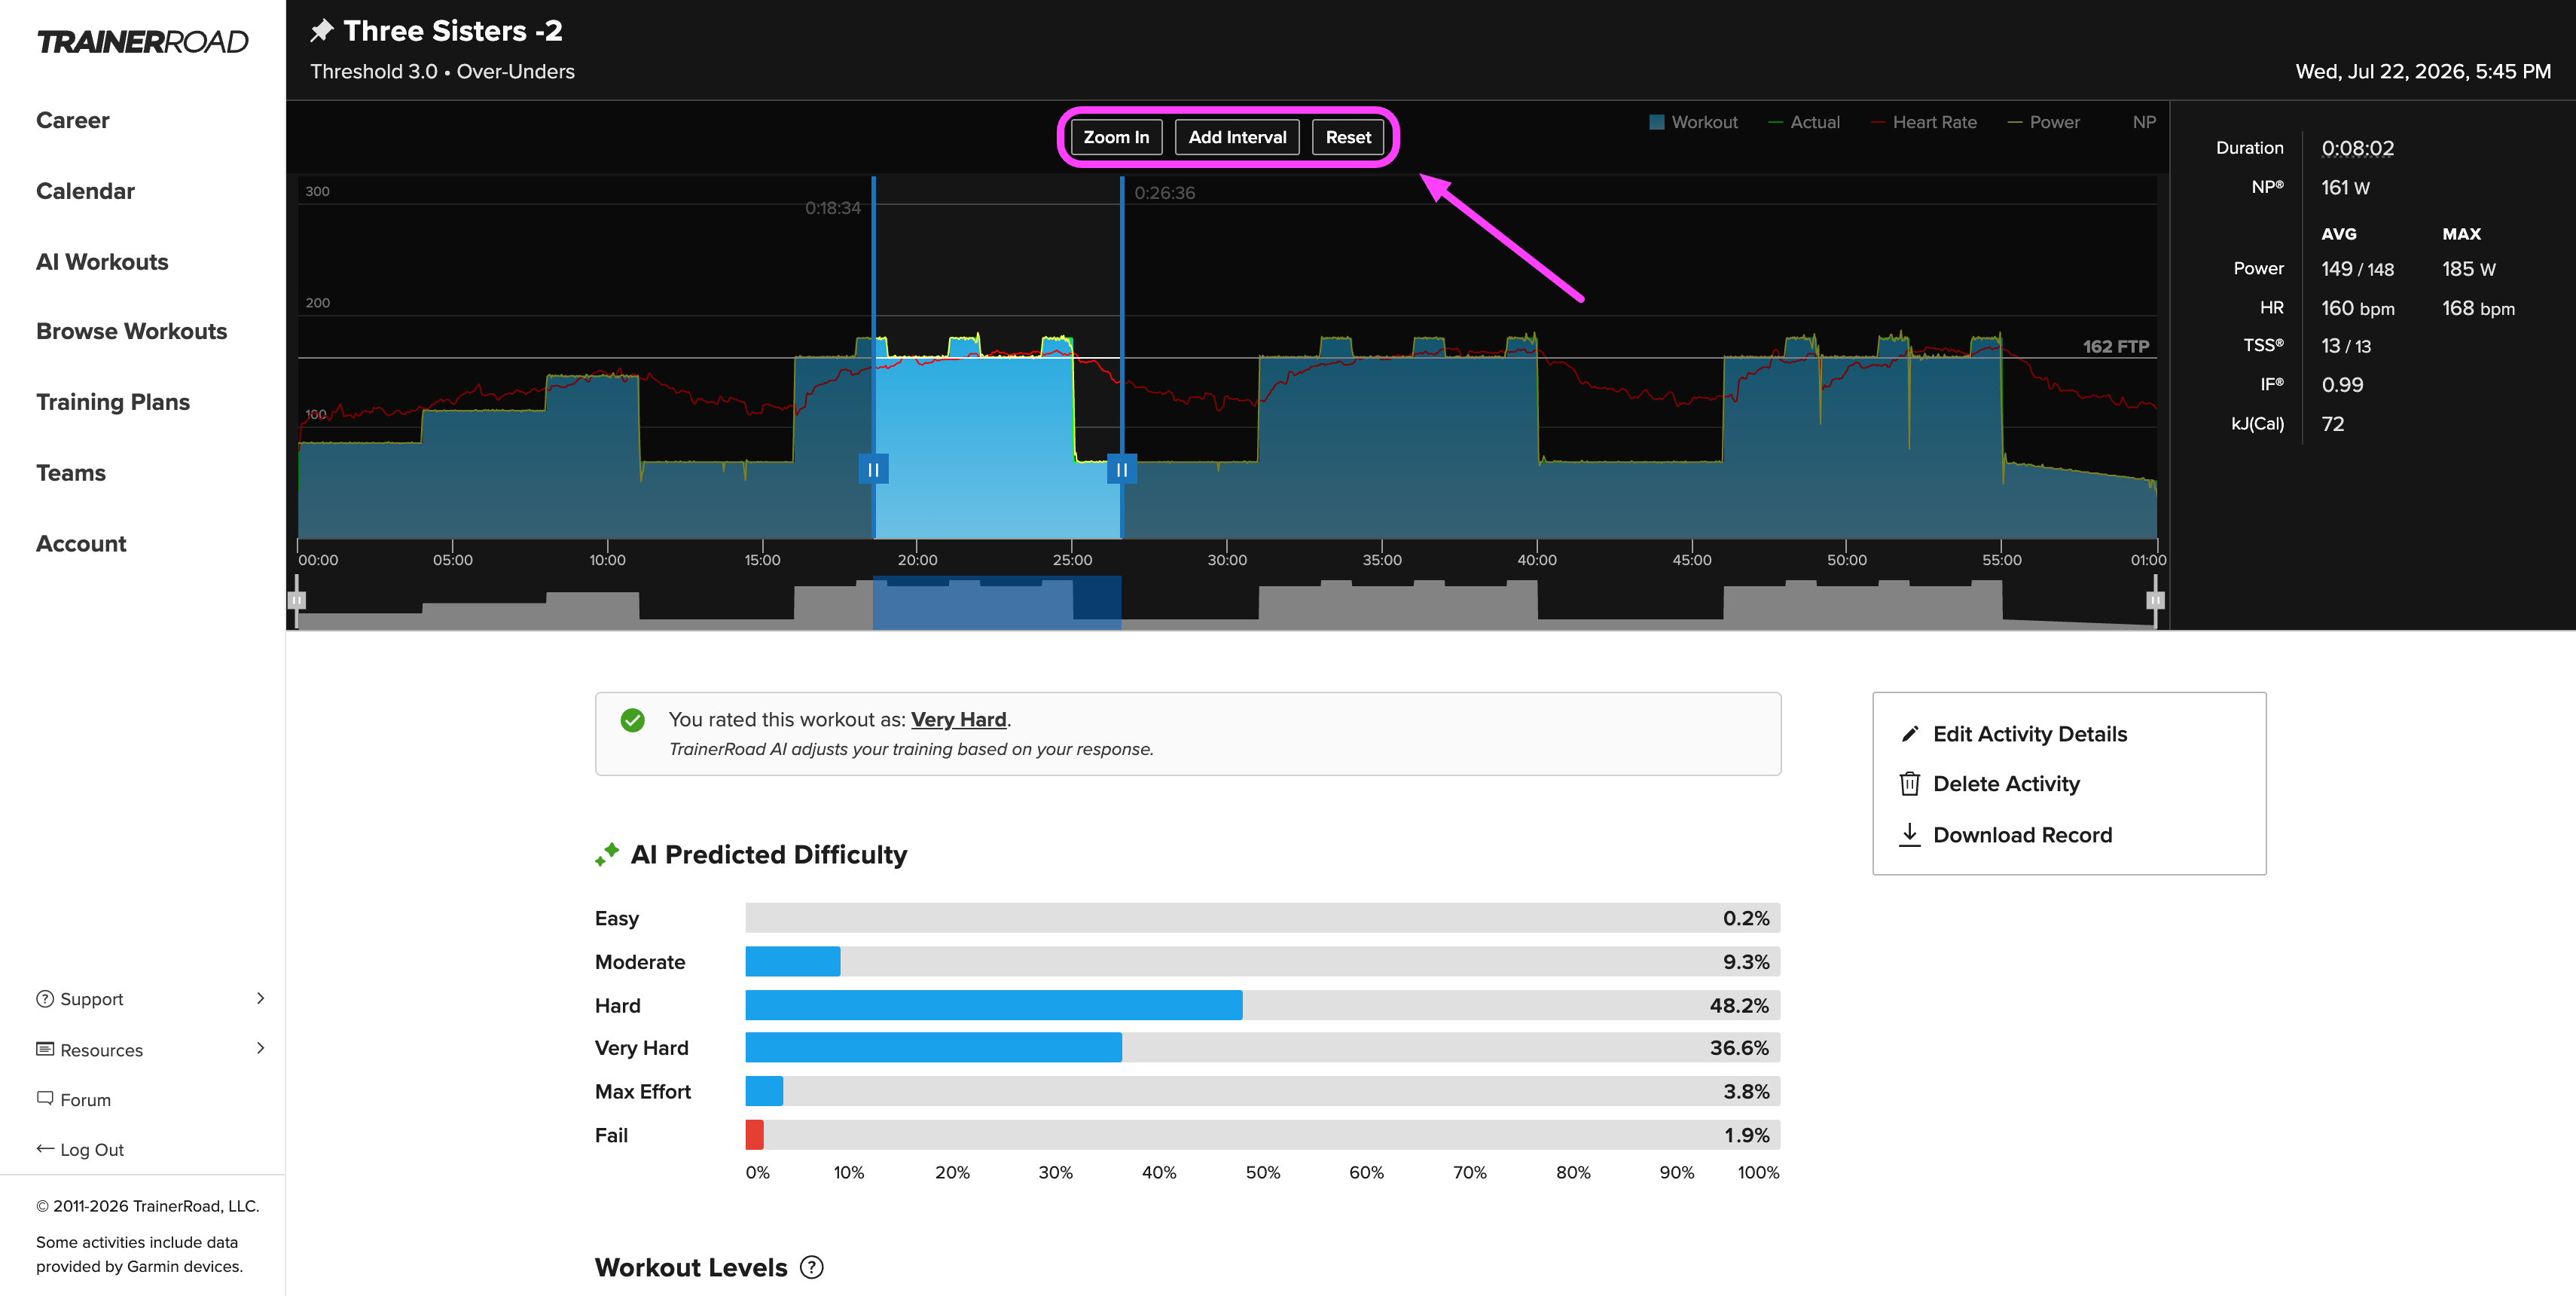
With a section selected, you can also use the buttons above the graph to, zoom In to magnify the selected section, add Interval to save the selection as a custom interval and reset to clear the selection and return to the full ride view.
From the workout graph at the top of the ride analysis page you can also find:
- Legend toggles: Click the items in the legend above the graph to show or hide each data series, like heart rate or Normalized Power.
- Key Metric Panel: The panel to the right of the graph summarizes the ride, including duration, average and max power, heart rate, TSS, Intensity Factor, and kJ. For TrainerRoad workouts, your numbers appear next to the workout's target numbers.
- Workout FTP: The horizontal line labeled with your FTP shows how the ride's efforts compare to your threshold at the time of this workout.
Intervals
The Intervals tab below the graph lists every interval in the ride with its duration, Normalized Power, average power, heart rate, and cadence. TrainerRoad workouts list each interval by name. Outdoor rides list the laps recorded by your bike computer, plus any custom intervals you create.
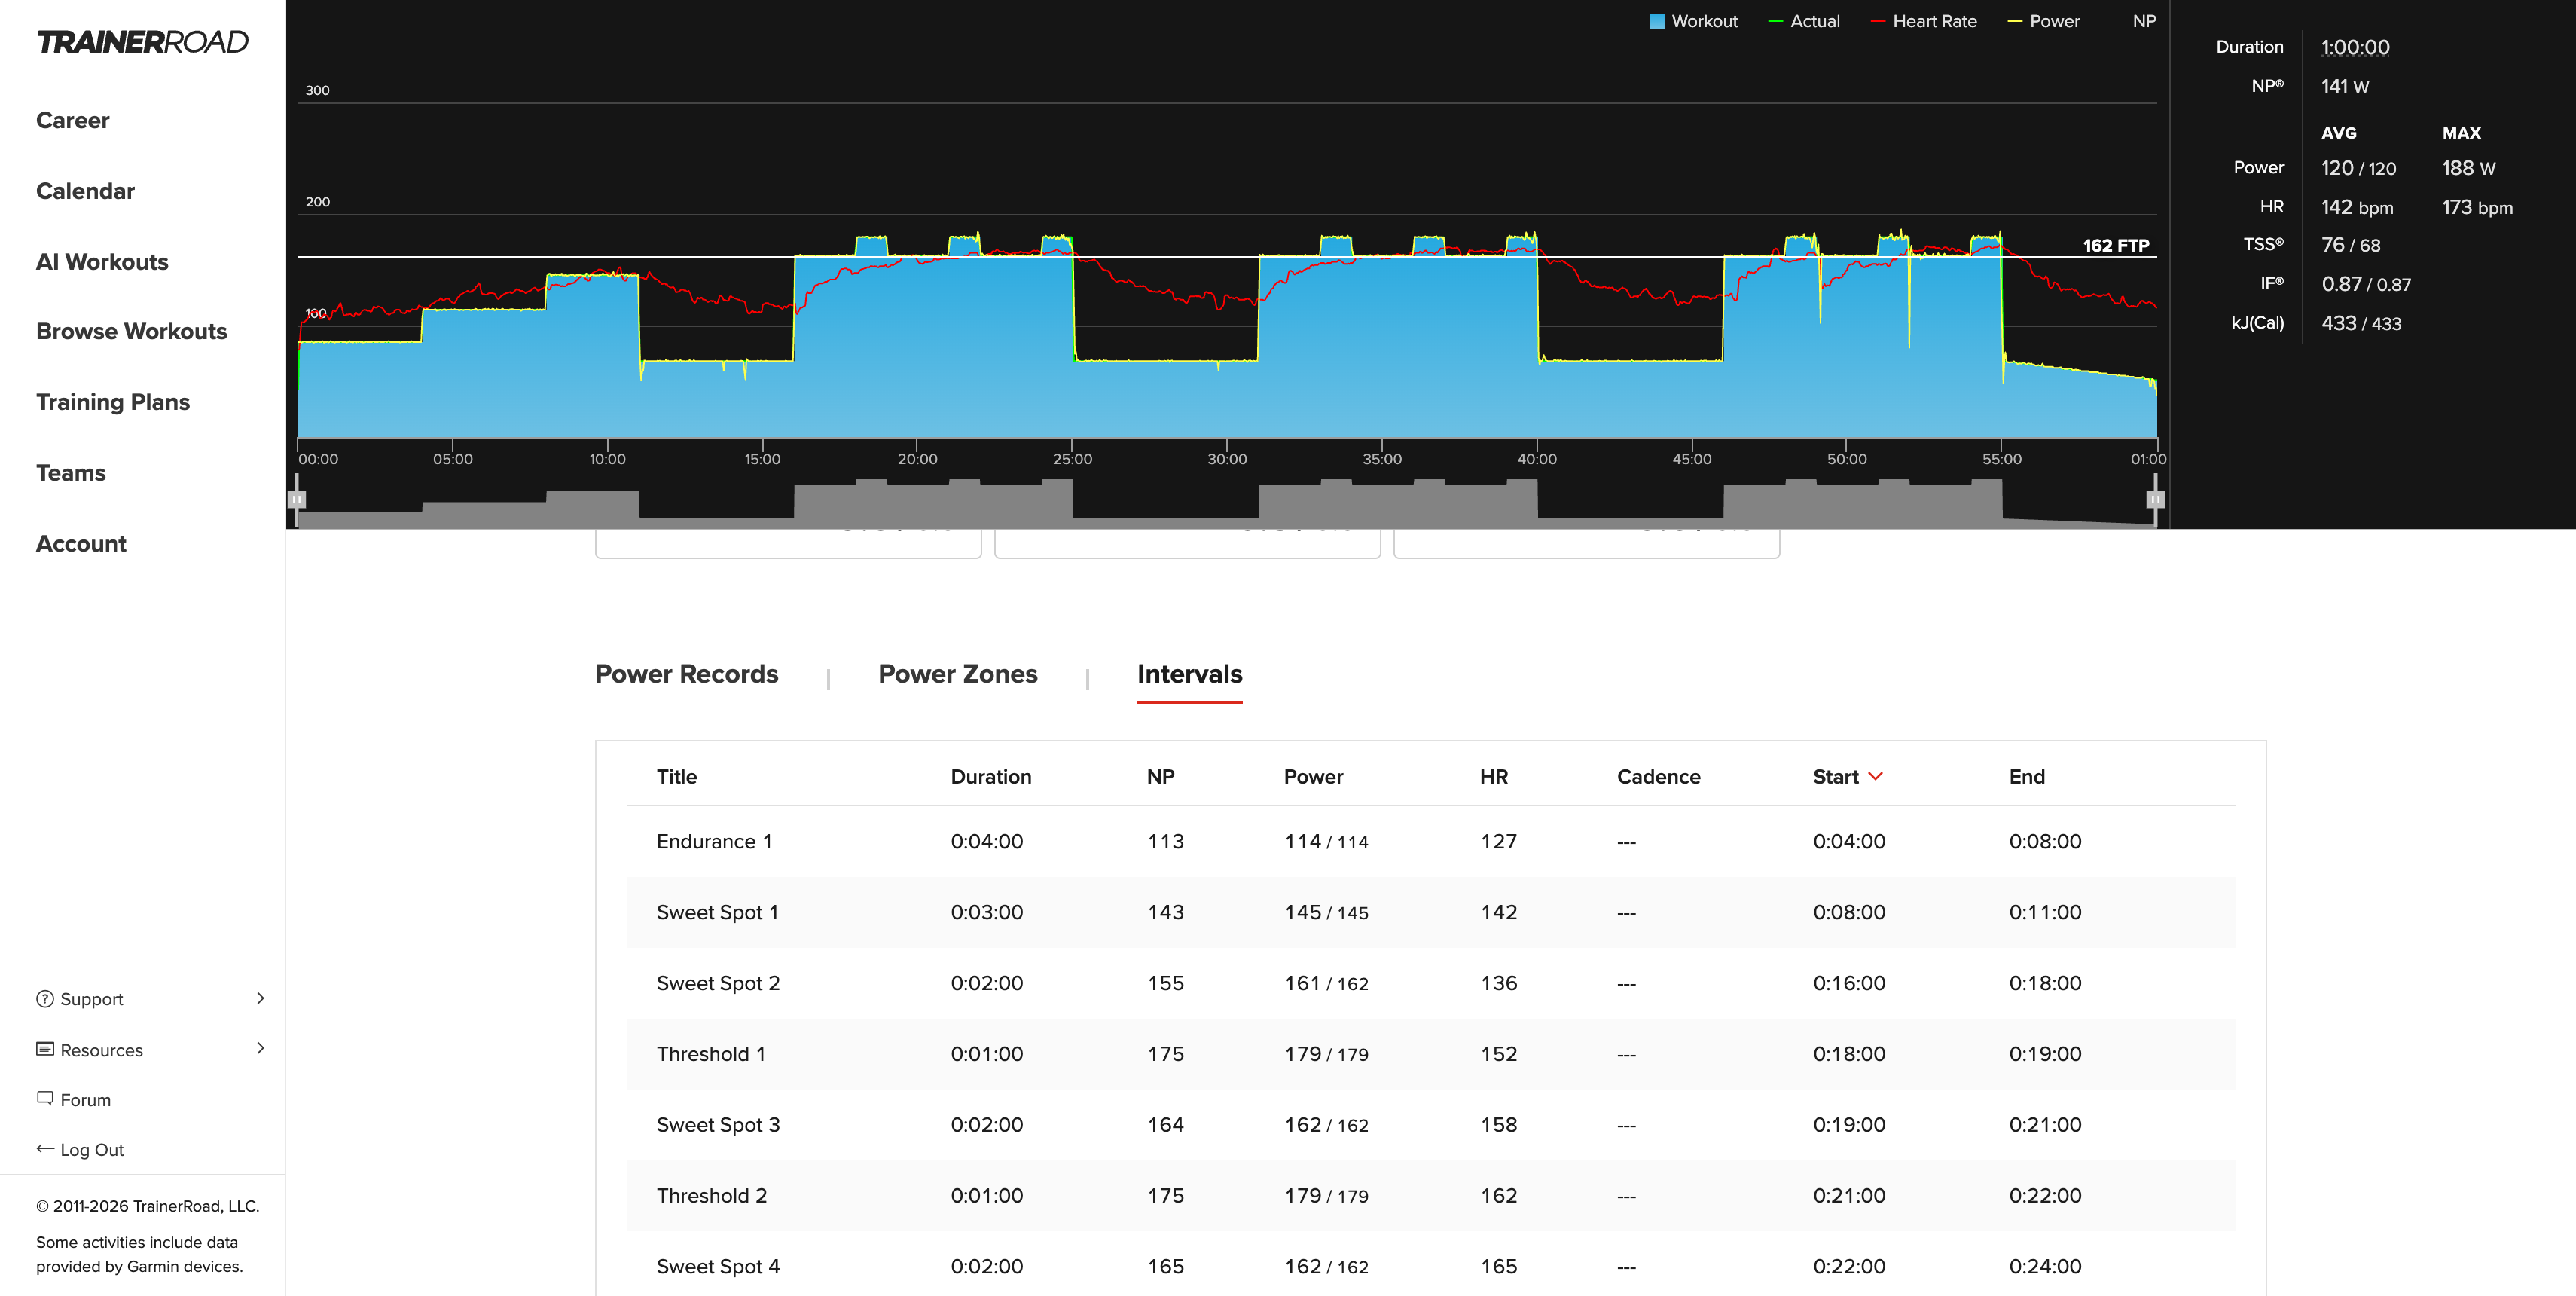
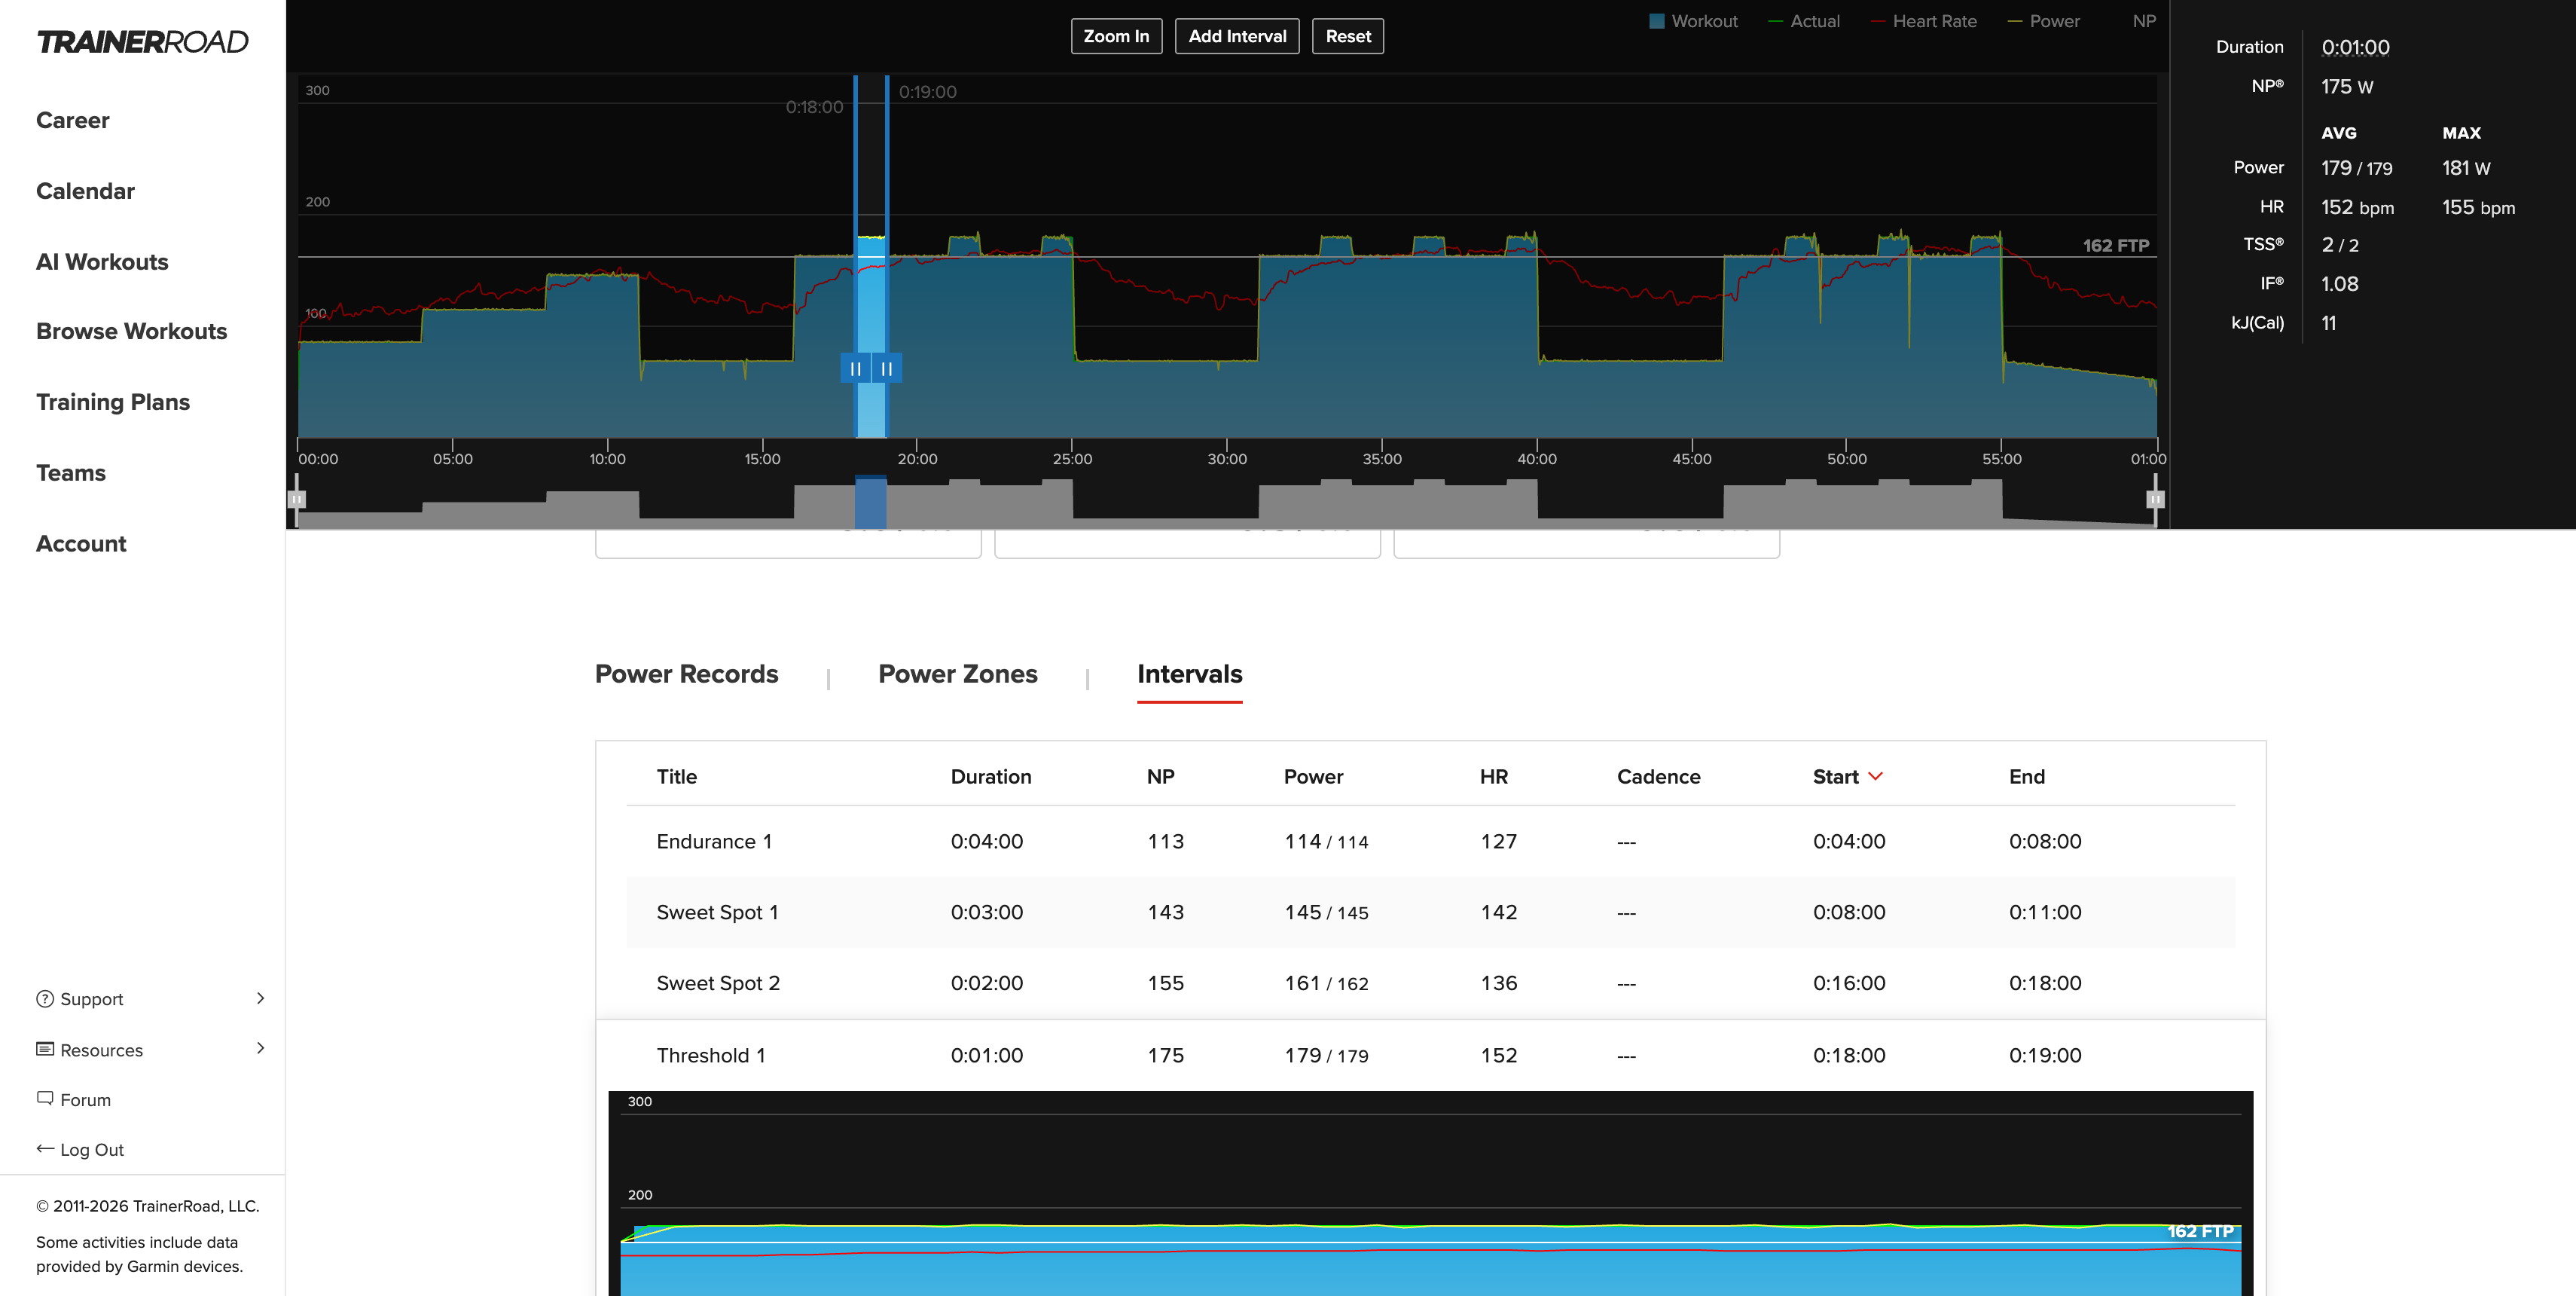
Click any interval in the table to highlight that section of the ride on the graph. The metrics panel updates to show the stats for that interval.
How to Create Custom Intervals
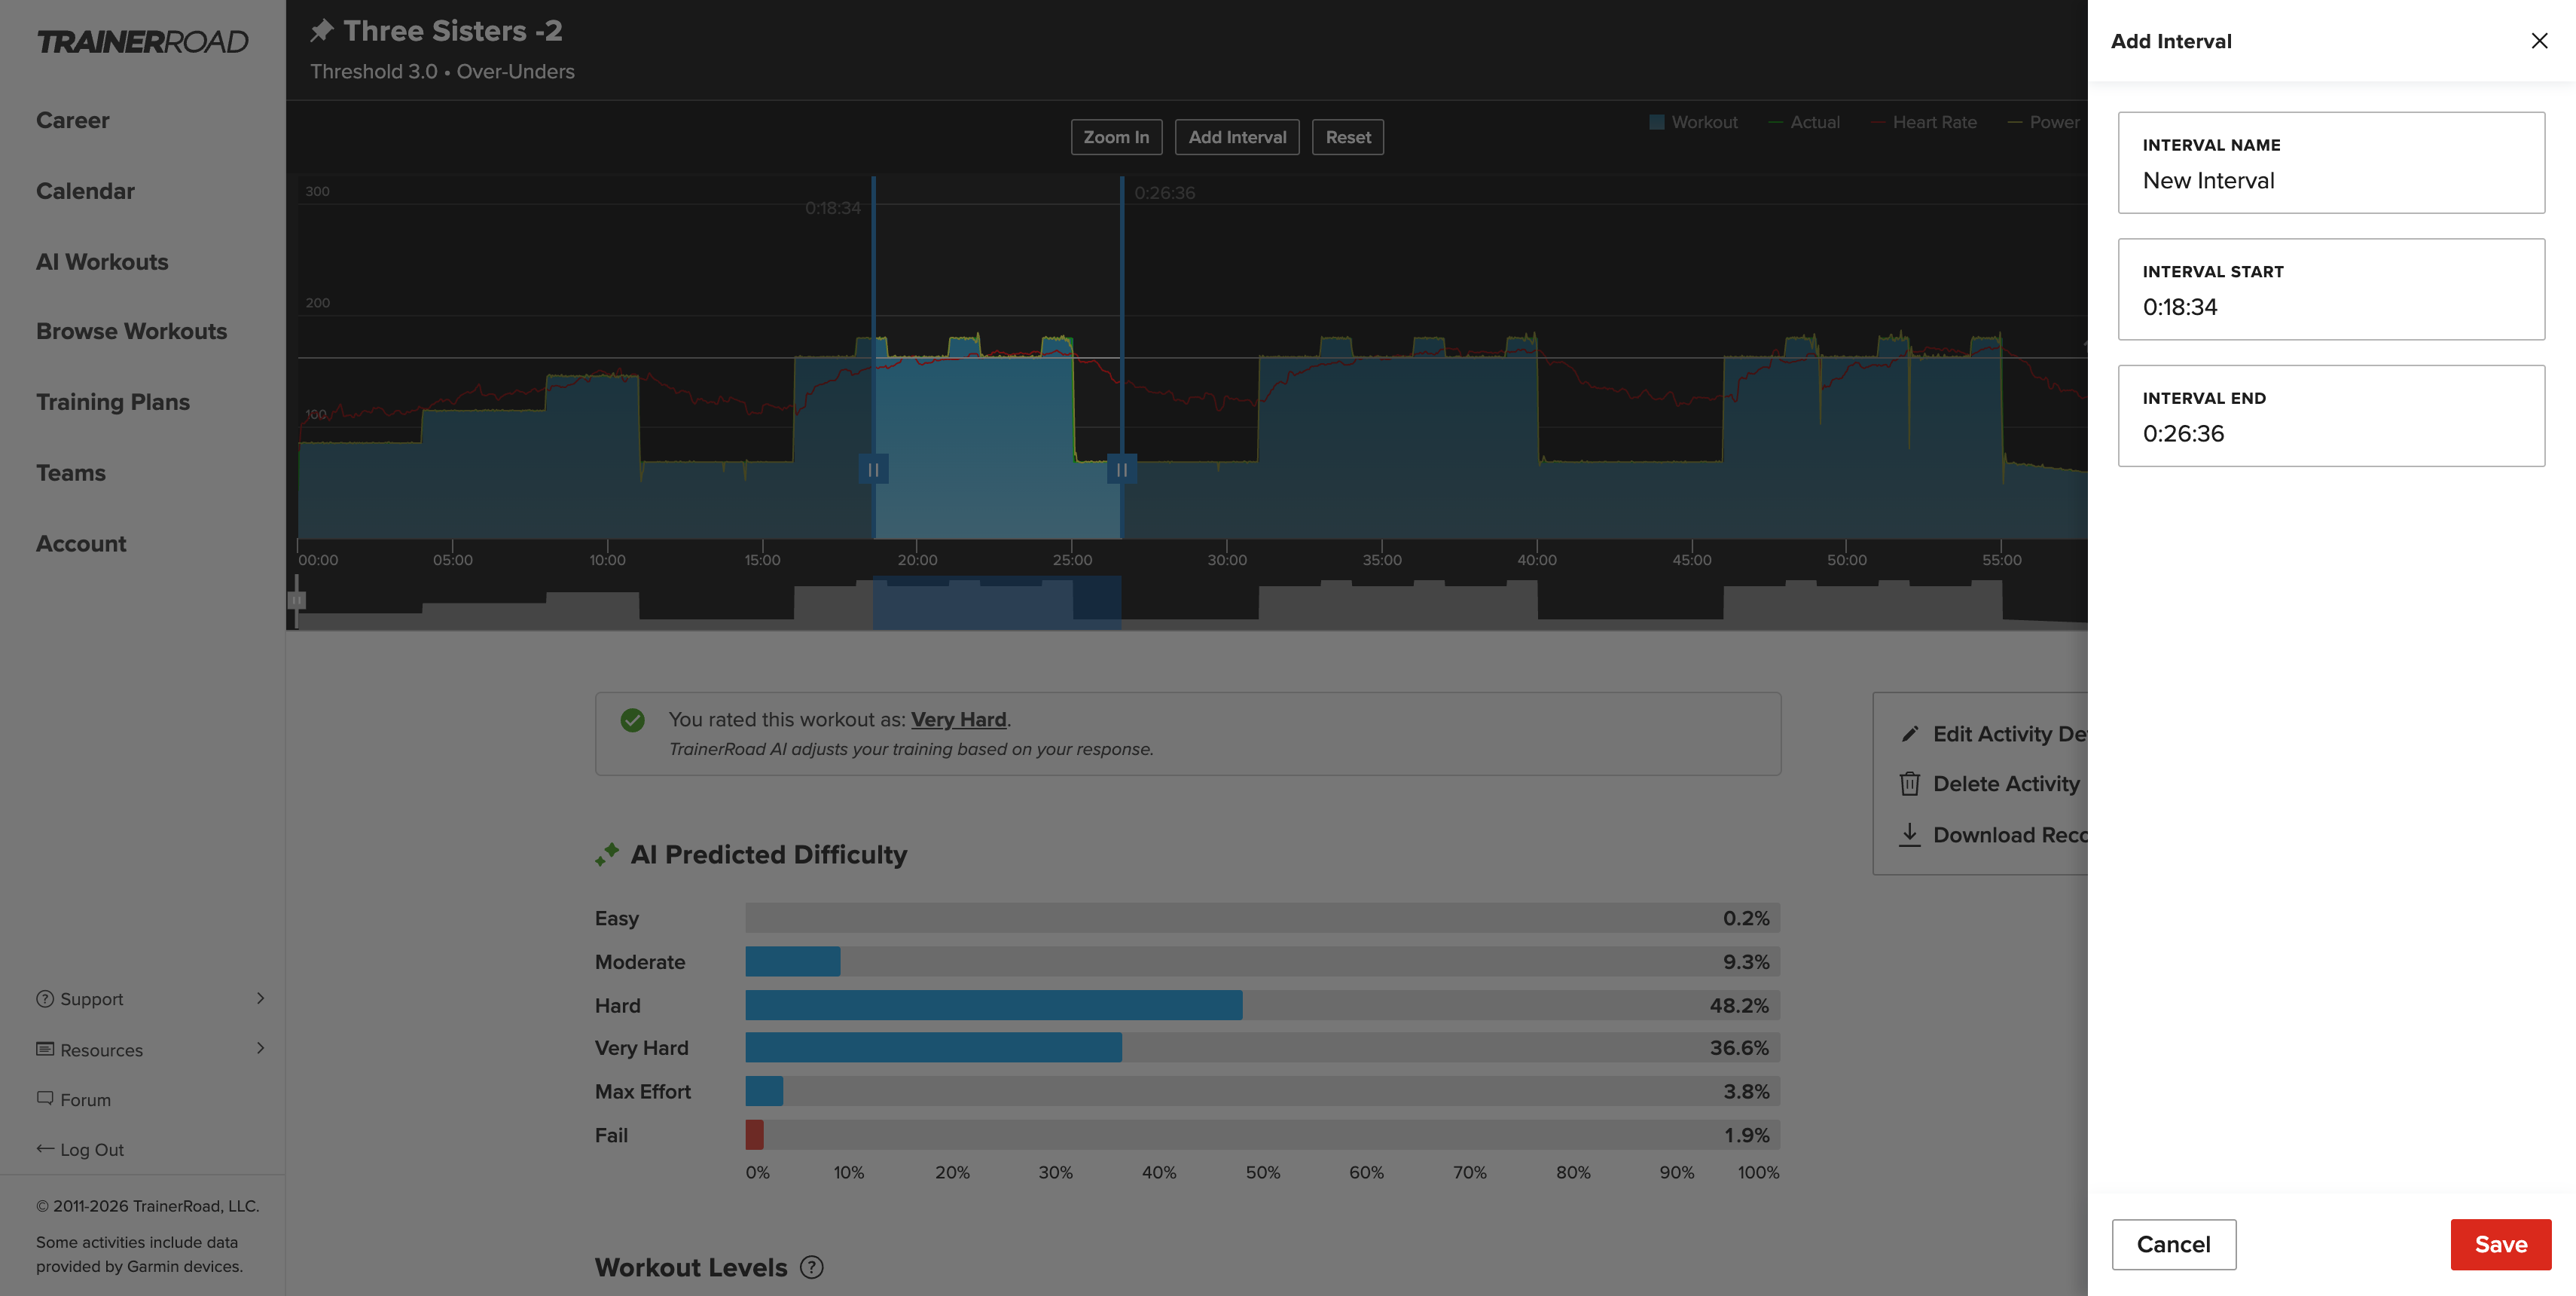
You can also create custom intervals for a workout using the workout graph at the top of the ride analysis page. Here is how you can create a custom interval:
Step One: Click and drag across the graph to select the section you want to save.
Step Two: Click Add Interval above the graph.
Step Three: Give the interval a name, fine-tune the start and end times if needed, and click Save. Your custom interval now appears in the Intervals table alongside the rest of the ride's intervals.
Power Zones
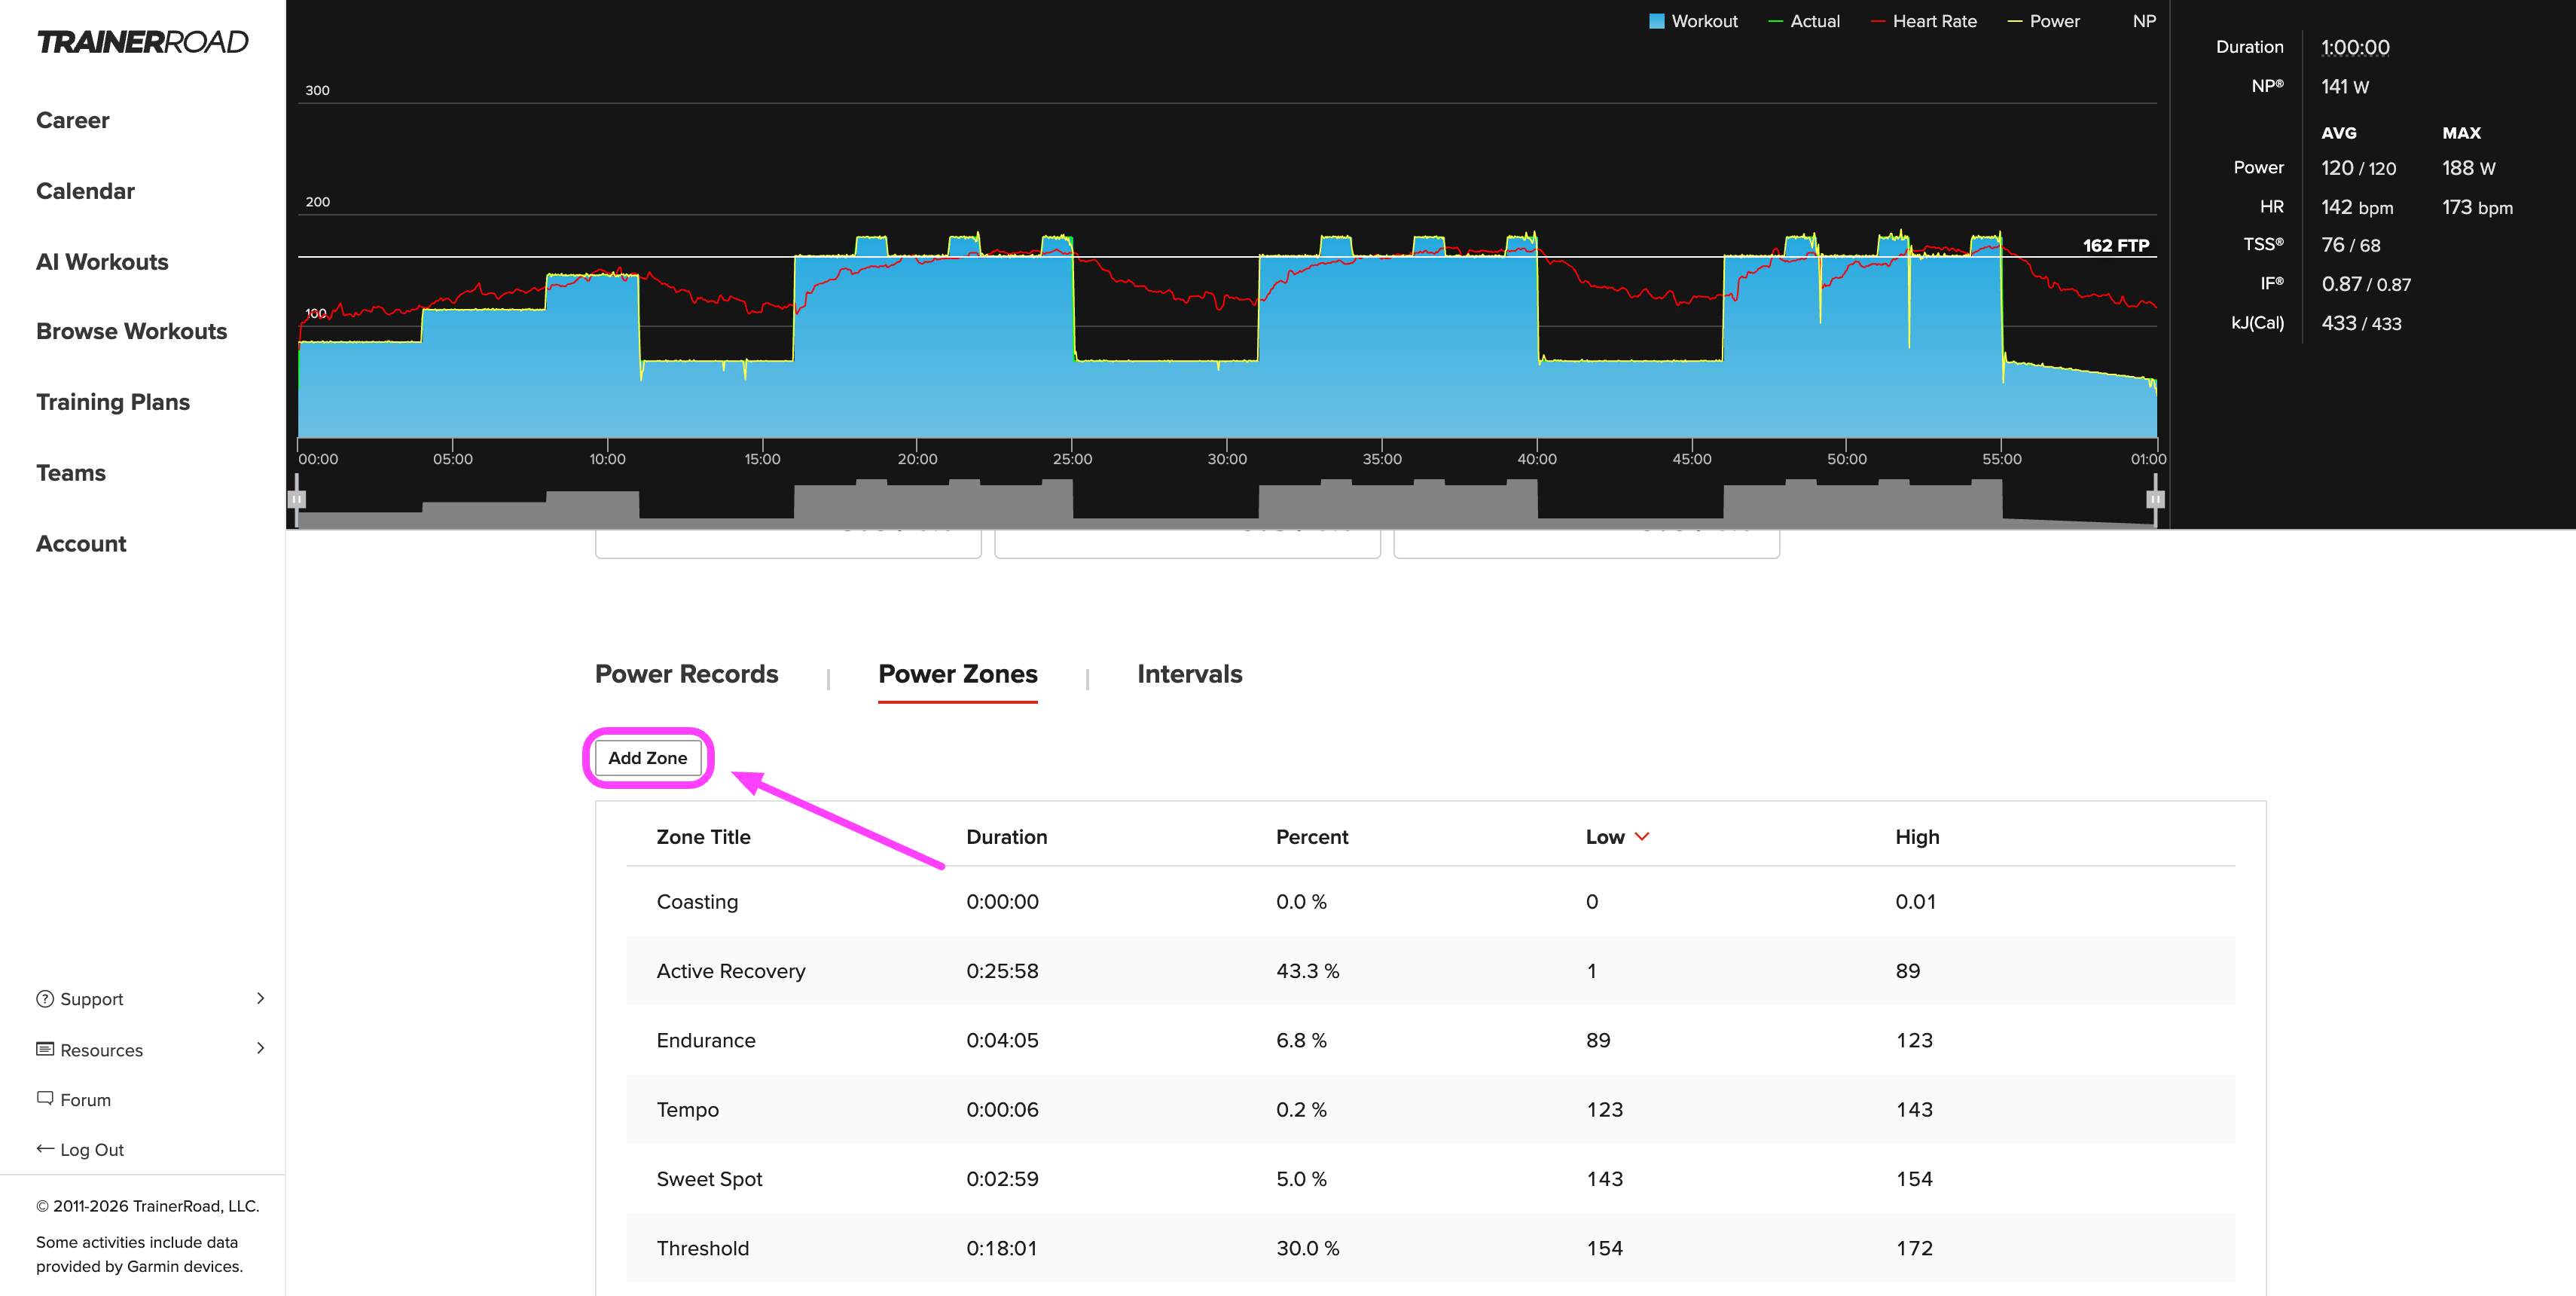
The Power Zones tab shows how much time you spent in each power zone during the ride. Click a zone in the table to highlight that power range on the graph. You can also click Add Zone to create a custom zone with your own power range, and the bottom of the table shows which power source recorded the ride.
Power Records
The Power Records tab shows your best power for every duration within this ride, from short sprints to the full ride. For TrainerRoad workouts, the Prescribed line shows what the workout asked for, so you can see how your effort compared. Use the date range selectors to compare this ride against other time periods, and use the toggles above the chart to switch between Normalized Power, average power, and heart rate.
To explore your all-time power records across every ride, see How to Analyze Power Records.
Analyzing Your Outdoor Ride Data
Outdoor rides have everything that indoor rides with a few additional metrics like:
- Elevation profile: A gray elevation profile appears behind the graph.
- Outdoor metrics: The metrics panel adds distance, elevation gain, speed, and average gradient. The tooltip also shows elevation and grade as you move along the graph.
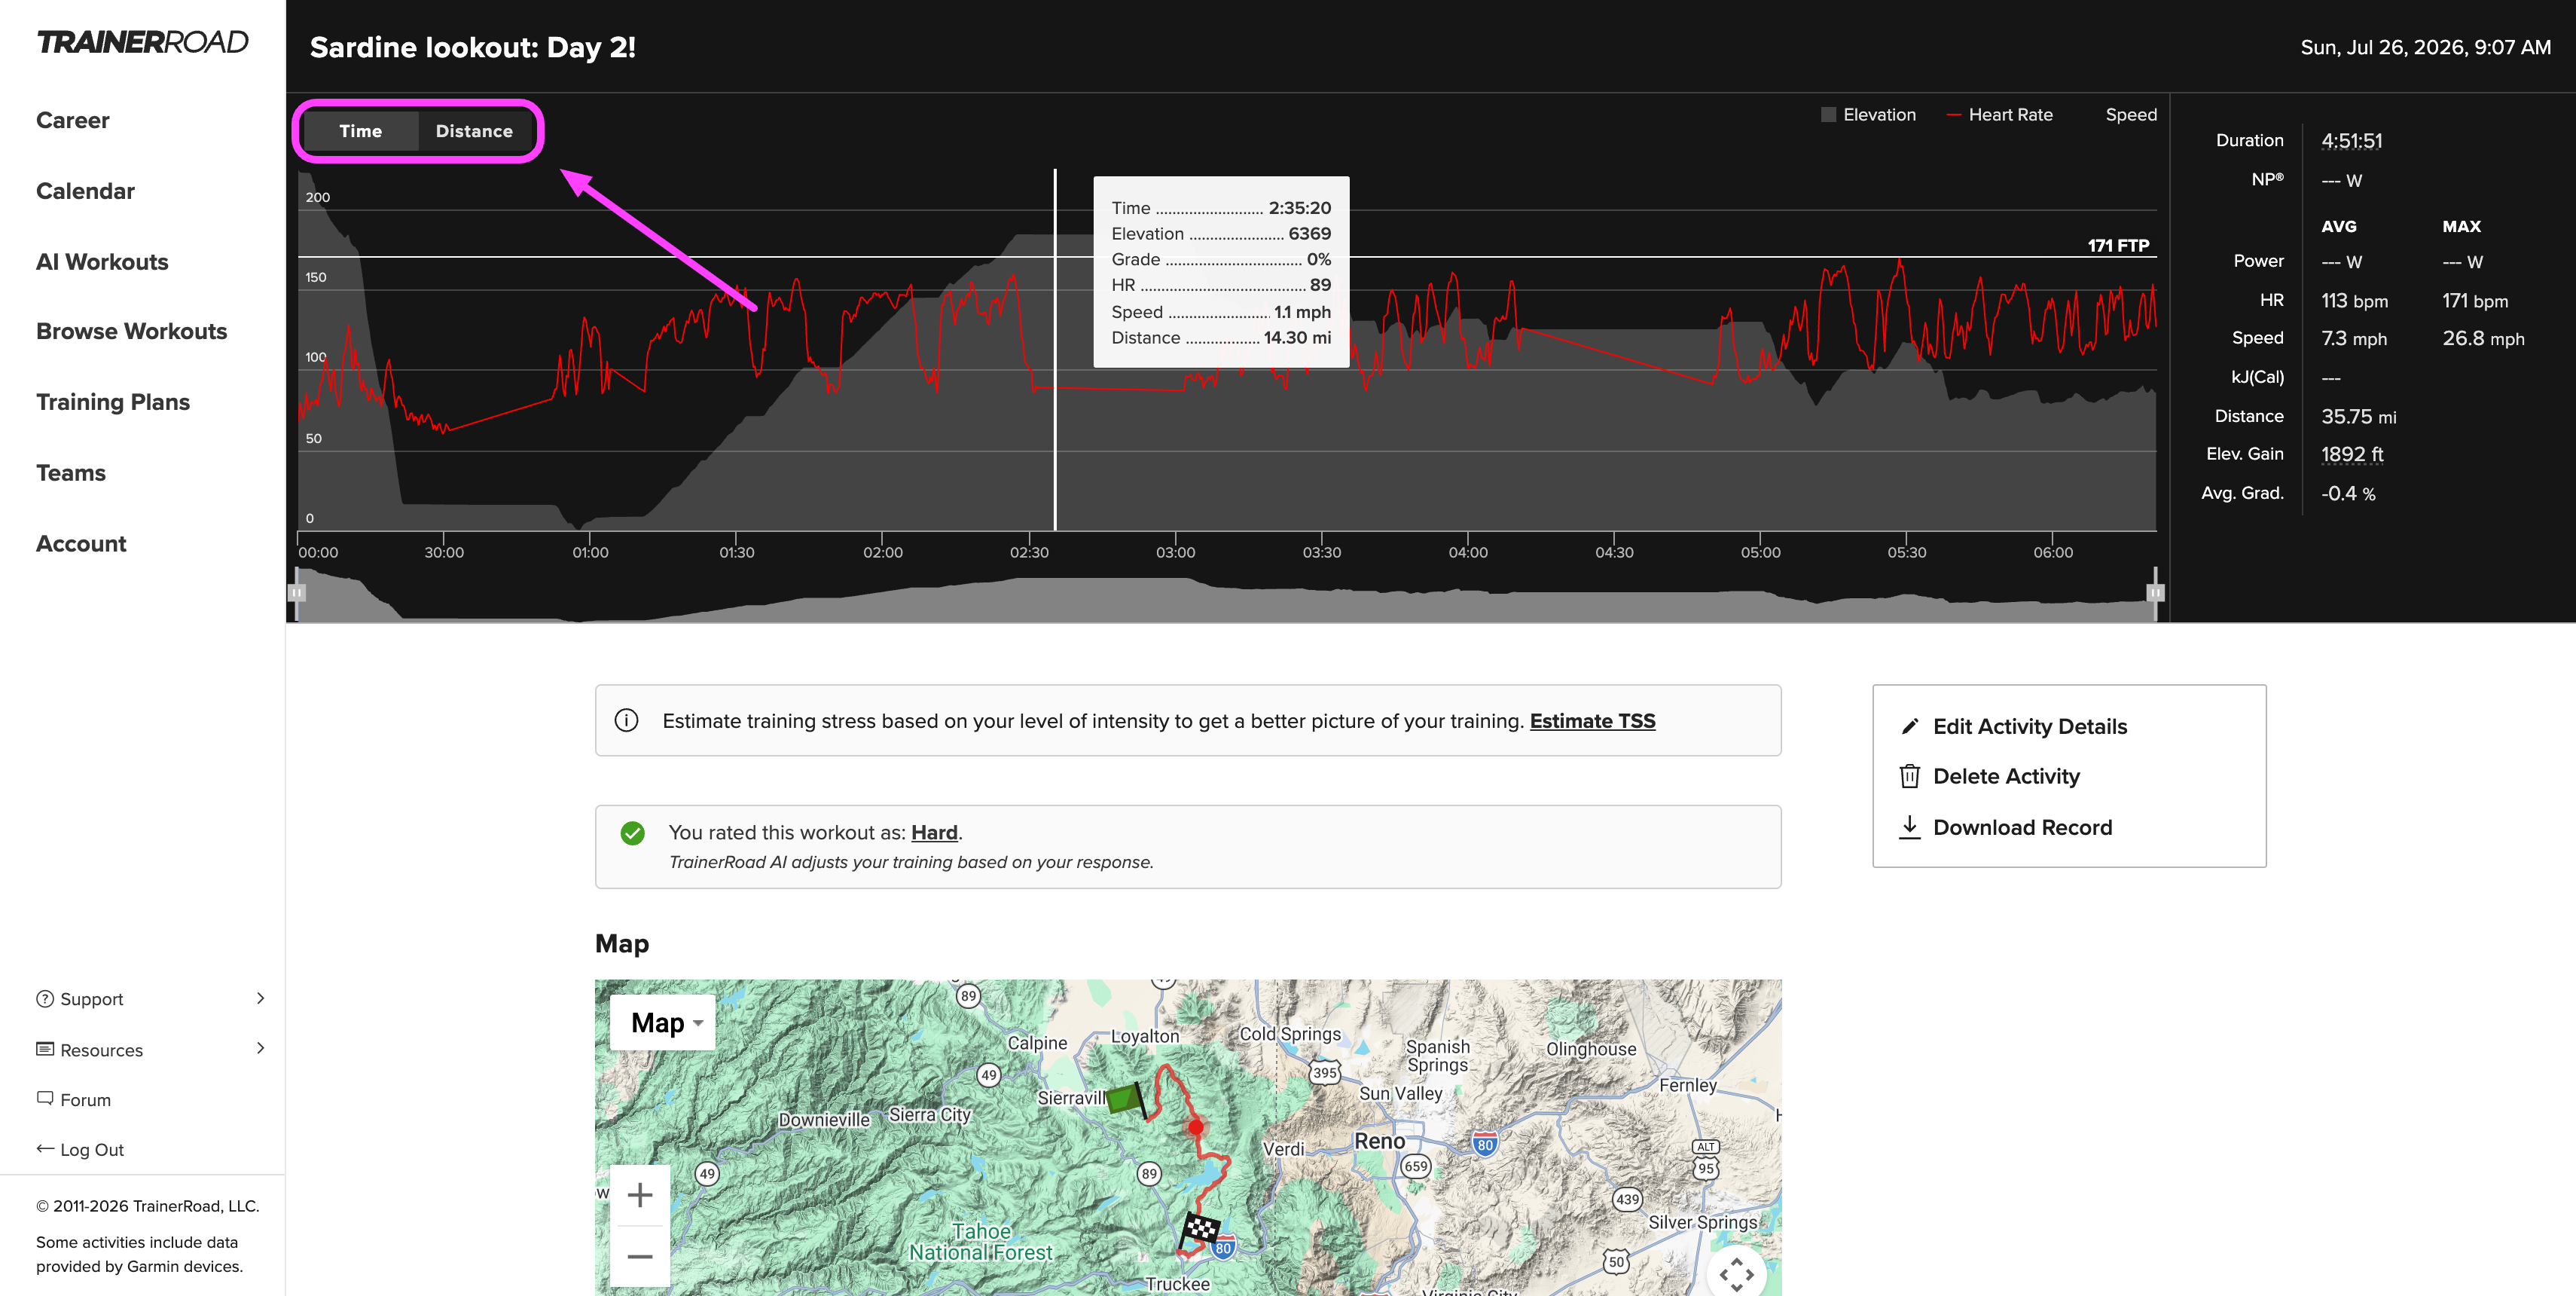
- Time or Distance: Use the toggle above the graph to switch the graph between time and distance.
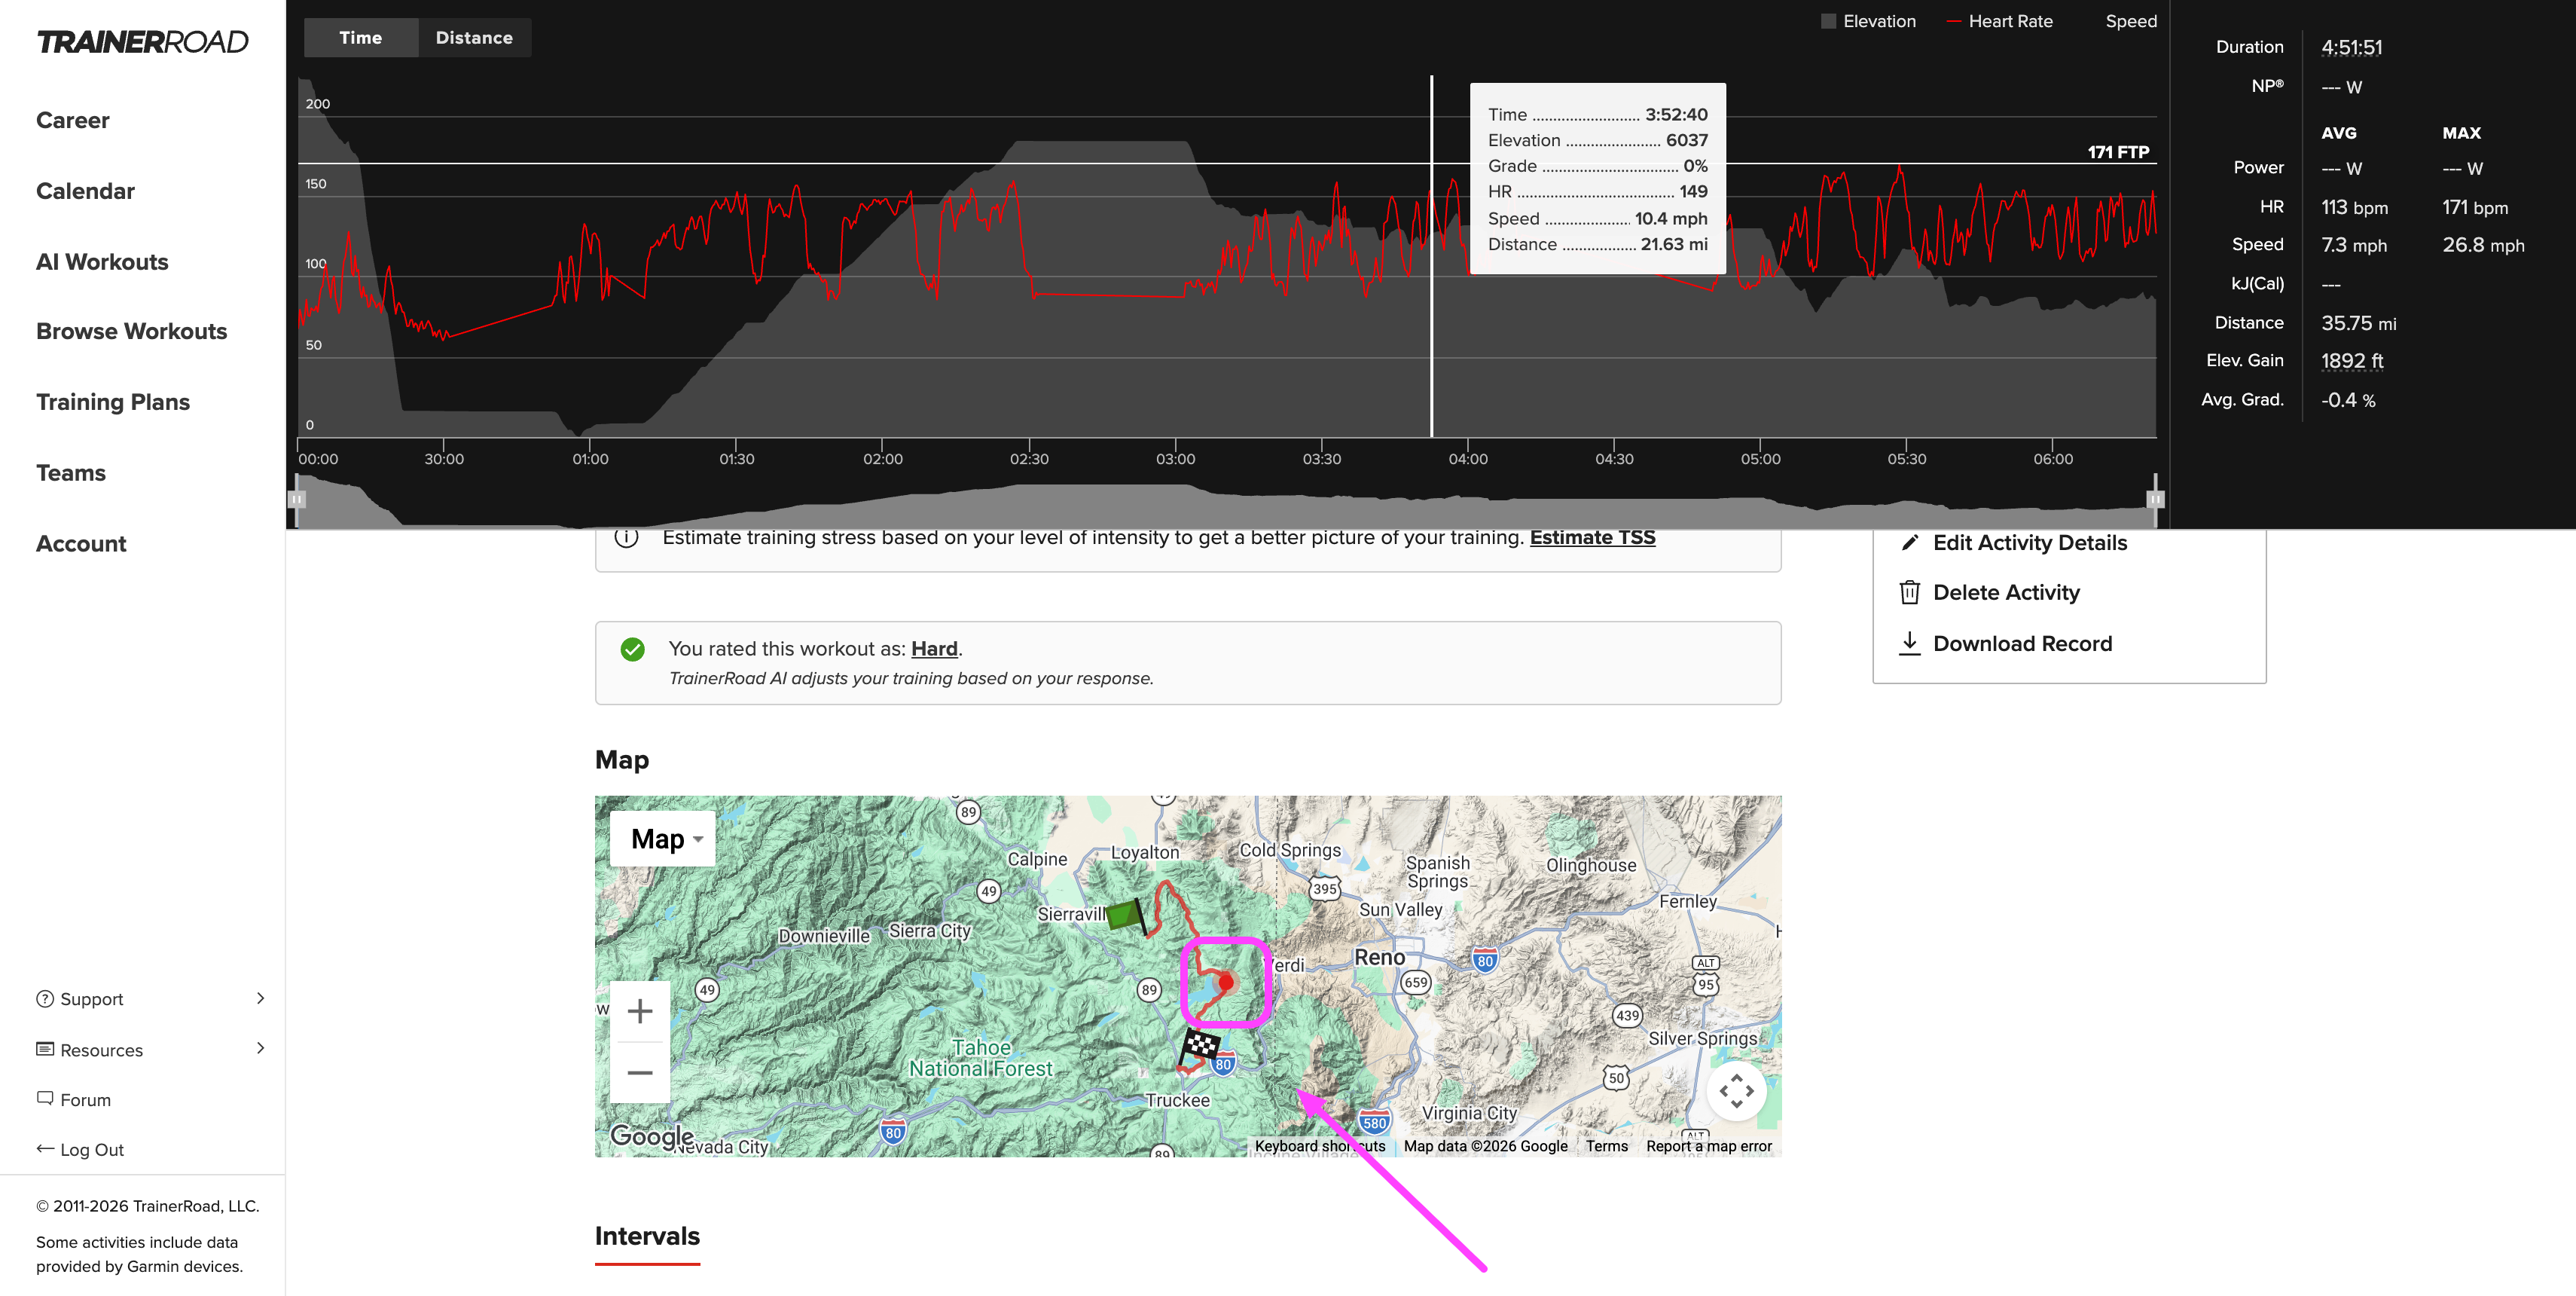
Rides with GPS data also include a map of your route with start and finish markers. As you move your cursor along the graph, a position marker moves along the route, so you can see exactly where on the road each effort happened.
What About Rides Without Power Data?
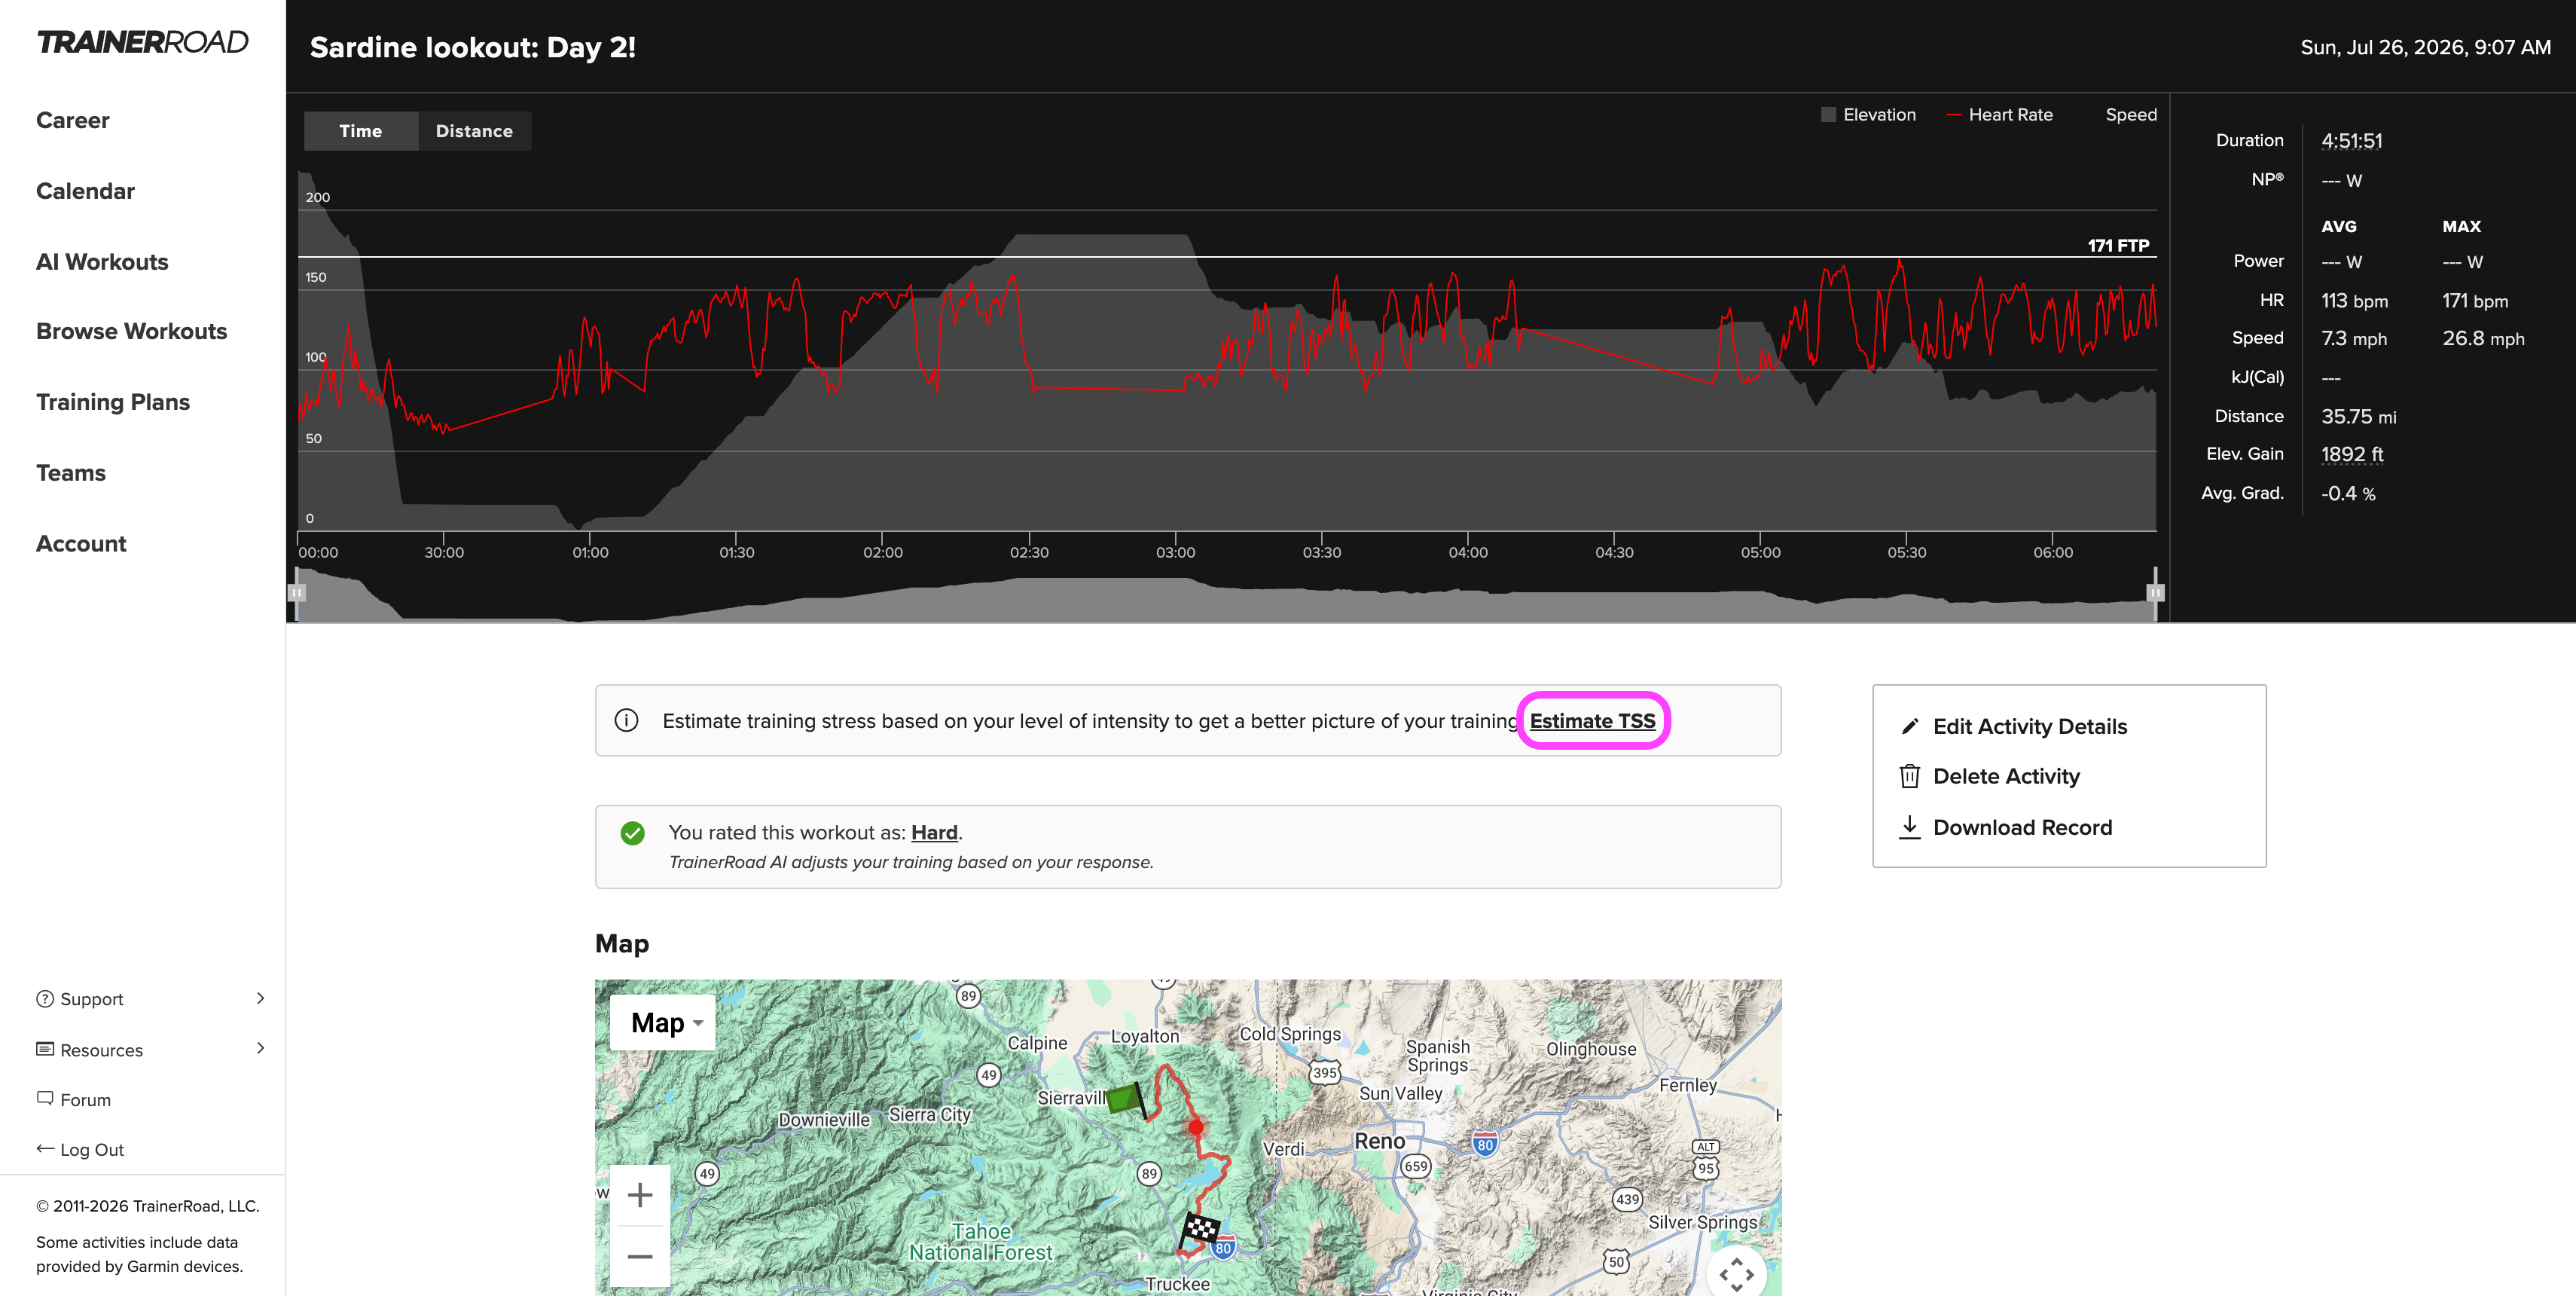
If a ride has no power data, the power-based tabs are hidden and you'll see the Intervals tab only. You can still estimate the ride's training stress so it counts toward your training. Click Estimate TSS in the banner at the top of the page and rate the ride's intensity. For more detail, see How to Estimate Training Stress with Heart Rate Data.
More on the Ride Analysis Page
- Post Workout Survey: The banner above the ride details shows your survey response, and lets you add or change one. Your responses help TrainerRoad AI adjust your training. Learn more in What are Post Workout Surveys?
- AI Predicted Difficulty: For TrainerRoad workouts, this chart shows how difficult TrainerRoad AI predicted the workout would be for you. Learn more in AI Predicted Difficulty.
- Workout Levels: For TrainerRoad workouts, you'll see the workout's levels and any Progression Level changes you earned. Learn more in Workout Levels.
- Edit, Delete, and Download: Use the panel on the right to edit the activity's details, delete the activity, or download the ride as a .fit file.
Analyzing a run instead? See How to Sync and Analyze Runs in TrainerRoad.